
Novogene AMEA
  • Novogene AMEA
  • Genomics
    • Human Whole Genome Sequencing
    • Plant and Animal Whole Genome Sequencing
    • Microbial Whole Genome Sequencing
    • Plant and Animal De novo Sequencing
    • Microbial De novo Sequencing
    • Shotgun Metagenomics Sequencing
    • Amplicon Sequencing
    • Whole Exome Sequencing
    Transcriptomics
    • mRNA Sequencing
    • Total RNA Sequencing
    • Full-Length Transcriptome Sequencing
    • Whole Transcriptome Sequencing
    • Small RNA Sequencing
    • Circular RNA Sequencing
    • Metatranscriptome Sequencing
    • Prokaryotic RNA Sequencing
    Single Cell & Spatial Omics
    • Single Cell Gene Expression
    • Single Cell Immune Profiling Sequencing
    • Single Cell Long Read Transcriptome
    • Visium HD Spatial Gene Expression
    • Stereo-Seq Spatial Gene Expression
    • Xenium In Situ Spatial Transcriptome
    Epigenomics
    • Whole Genome Bisulfite Sequencing (WGBS)
    • Directed DNA Methylation Sequencing (DM-Seq) NEW
    • Reduced Representation Bisulfite Sequencing (RRBS)
    • Chromatin Immunoprecipitation Sequencing (ChIP-seq)
    • RNA Immunoprecipitation Sequencing (RIP-seq)
    • Assay for Transposase-Accessible Chromatin with Sequencing (ATAC-seq)

    Premade Library

    • Sequencing Only on Illumina Sequencer
    • Sequencing Only on PacBio Sequencer
    Proteomics and Metabolomics
    • Olink Proteomics
    • Quantitative Proteomics
    • Untargeted Metabolomics
  • PromotionsPromotions
    • Platforms
    • Automated Delivery Platform (Falcon)
    • Bioinformatics Analysis Tool (NovoMagic)
    • Customer Service System (CSS)
    • Brochures
    • Case Studies
    • Webinar
    • Blog
    • Sample Guidelines
    • Cancer Research
    • Immuno-oncology
    • Agrigenomics
    • Environment
    • Food Science
    • Human Microbiome
    • Plant and Animal Microbiome
    • Drug Discovery and Development
    • Rare and Complex Diseases
    • About Us
    • Our Locations
    • News
    • Careers
  • Contact UsContact Us
  1. Home
  2. Resources
  3. Blog
  4. Achieving 98% Success Rate with Minimal 100 ng RNA Samples: A Comprehensive Look at Novogene’s Standard RNA-Seq Data

Achieving 98% Success Rate with Minimal 100 ng RNA Samples: A Comprehensive Look at Novogene’s Standard RNA-Seq Data

IntroductionOver the past decade, scientists have widely used Next-Generation Sequencing (NGS) technologies for transcriptomics. With RNA sequencing (RNA-seq), researchers can accurately measure and compare gene transcriptional levels. To assess the stability of Novogene’s library construction processes for low initial RNA inputs, Novogene conducted a series of experiments utilizing the human universal reference RNA standard (UHRR, Agilent p/n 740000). This standard, widely recognized for its consistency and reliability, provided a rigorous testing ground for Novogene’s methods.
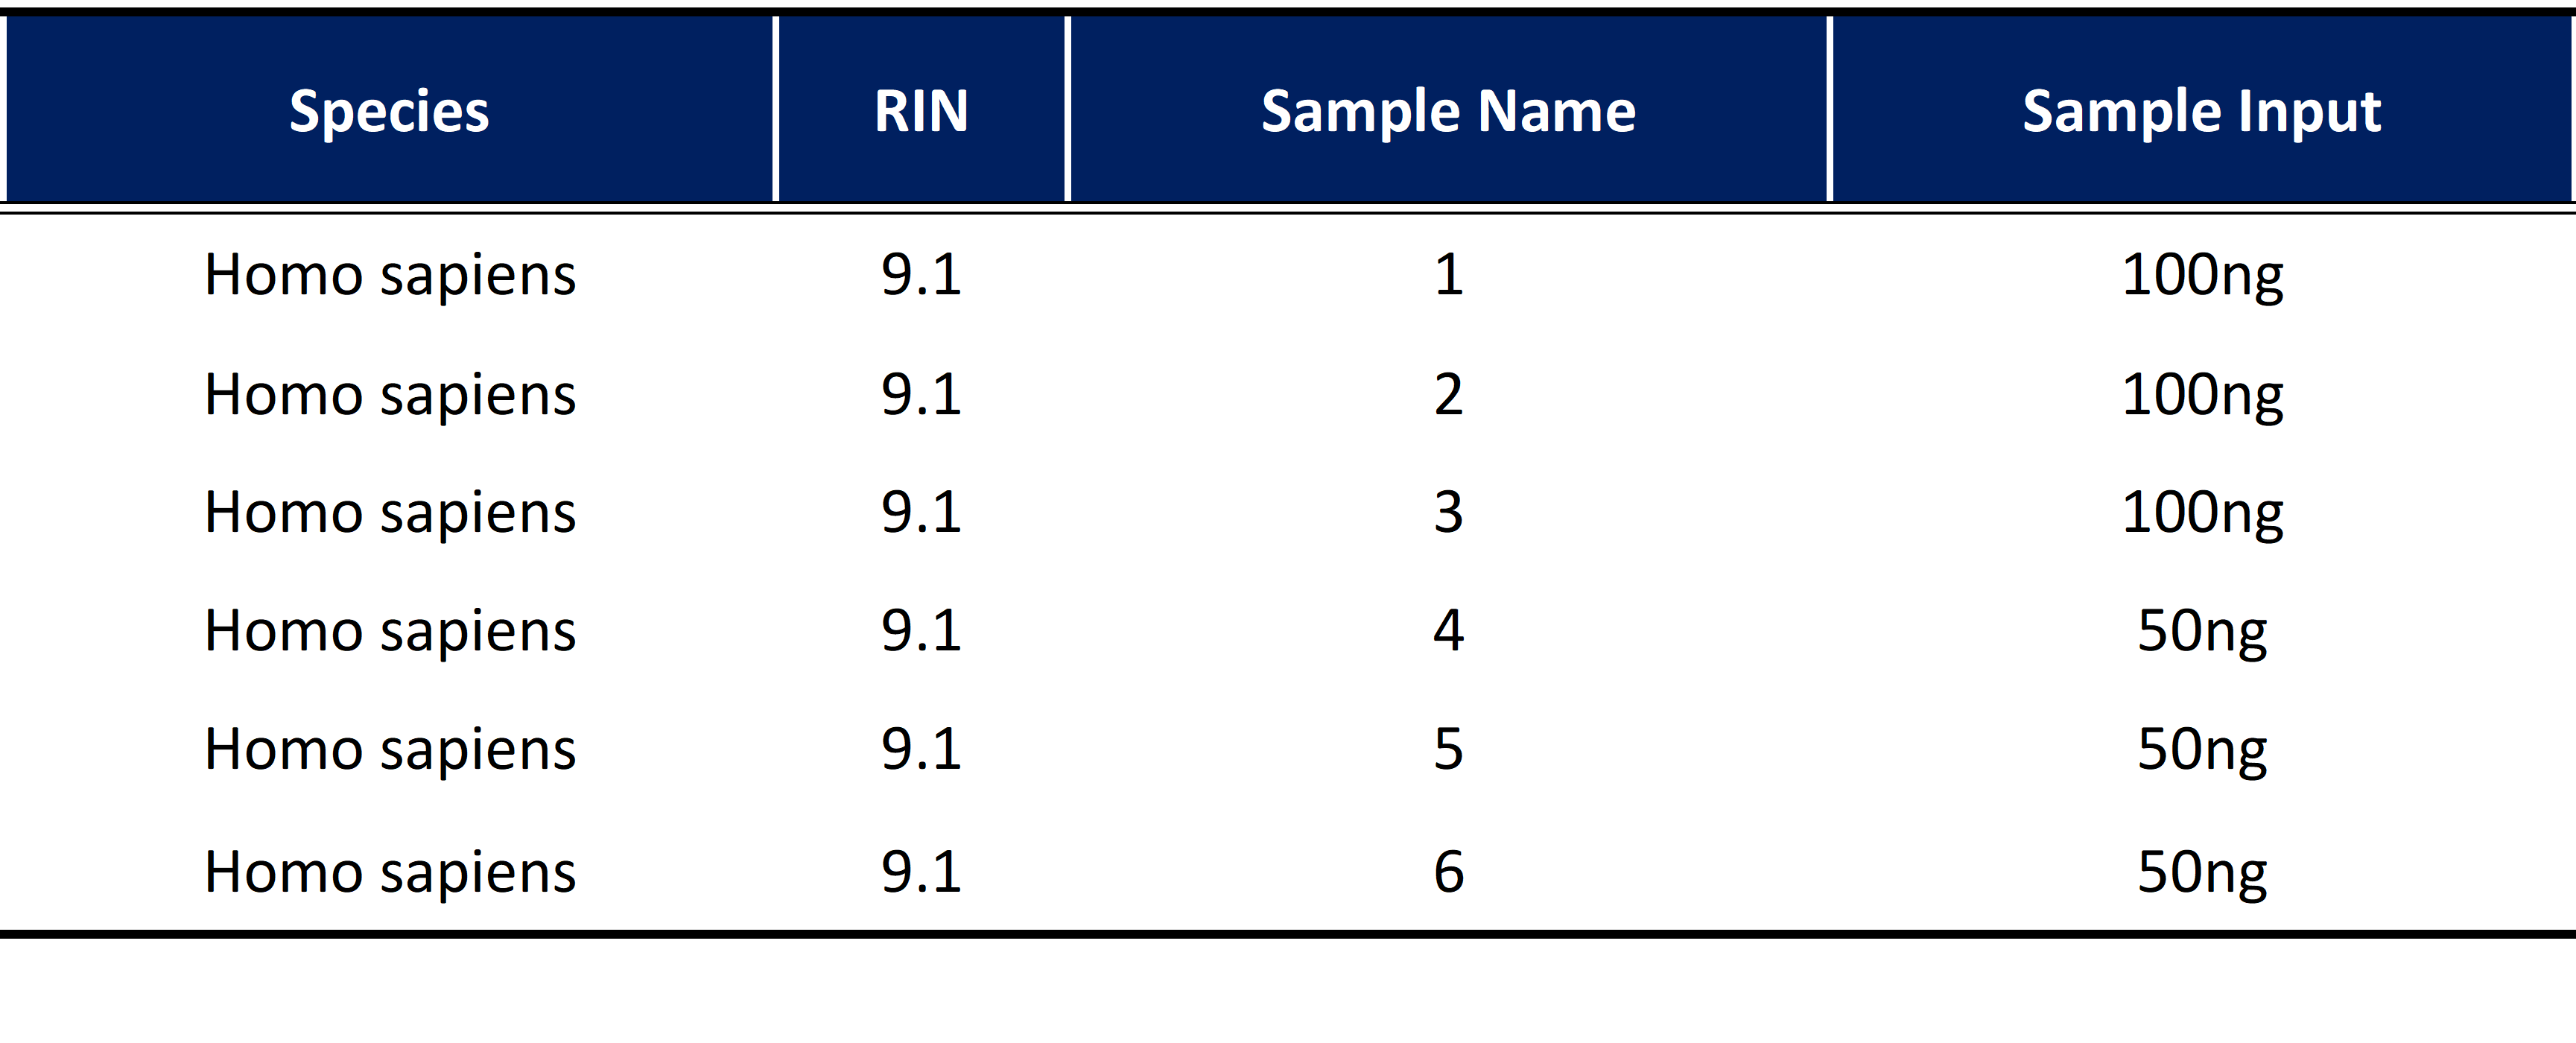
Experimental DesignThe Universal Human Reference RNA (UHRR) standard obtained from the same source was divided into six parts for the experiment (Table 1). Two groups were established, initiating with 50 ng and 100 ng, respectively. Each group consisted of three technical replicates. Short-read sequencing was employed using Illumina NovaSeq platform with paired-end 150bp (PE150) strategy, yielding 6 Gb of data per sample.

Table 1 | Sample information
Analysis Results1. Quality controlAfter preparing the library and sequencing the data, the raw data was filtered and checked for errors. The GC content was analyzed, and clean reads were then ready for further analysis. The sequencing data QC metrics reveals promising results.

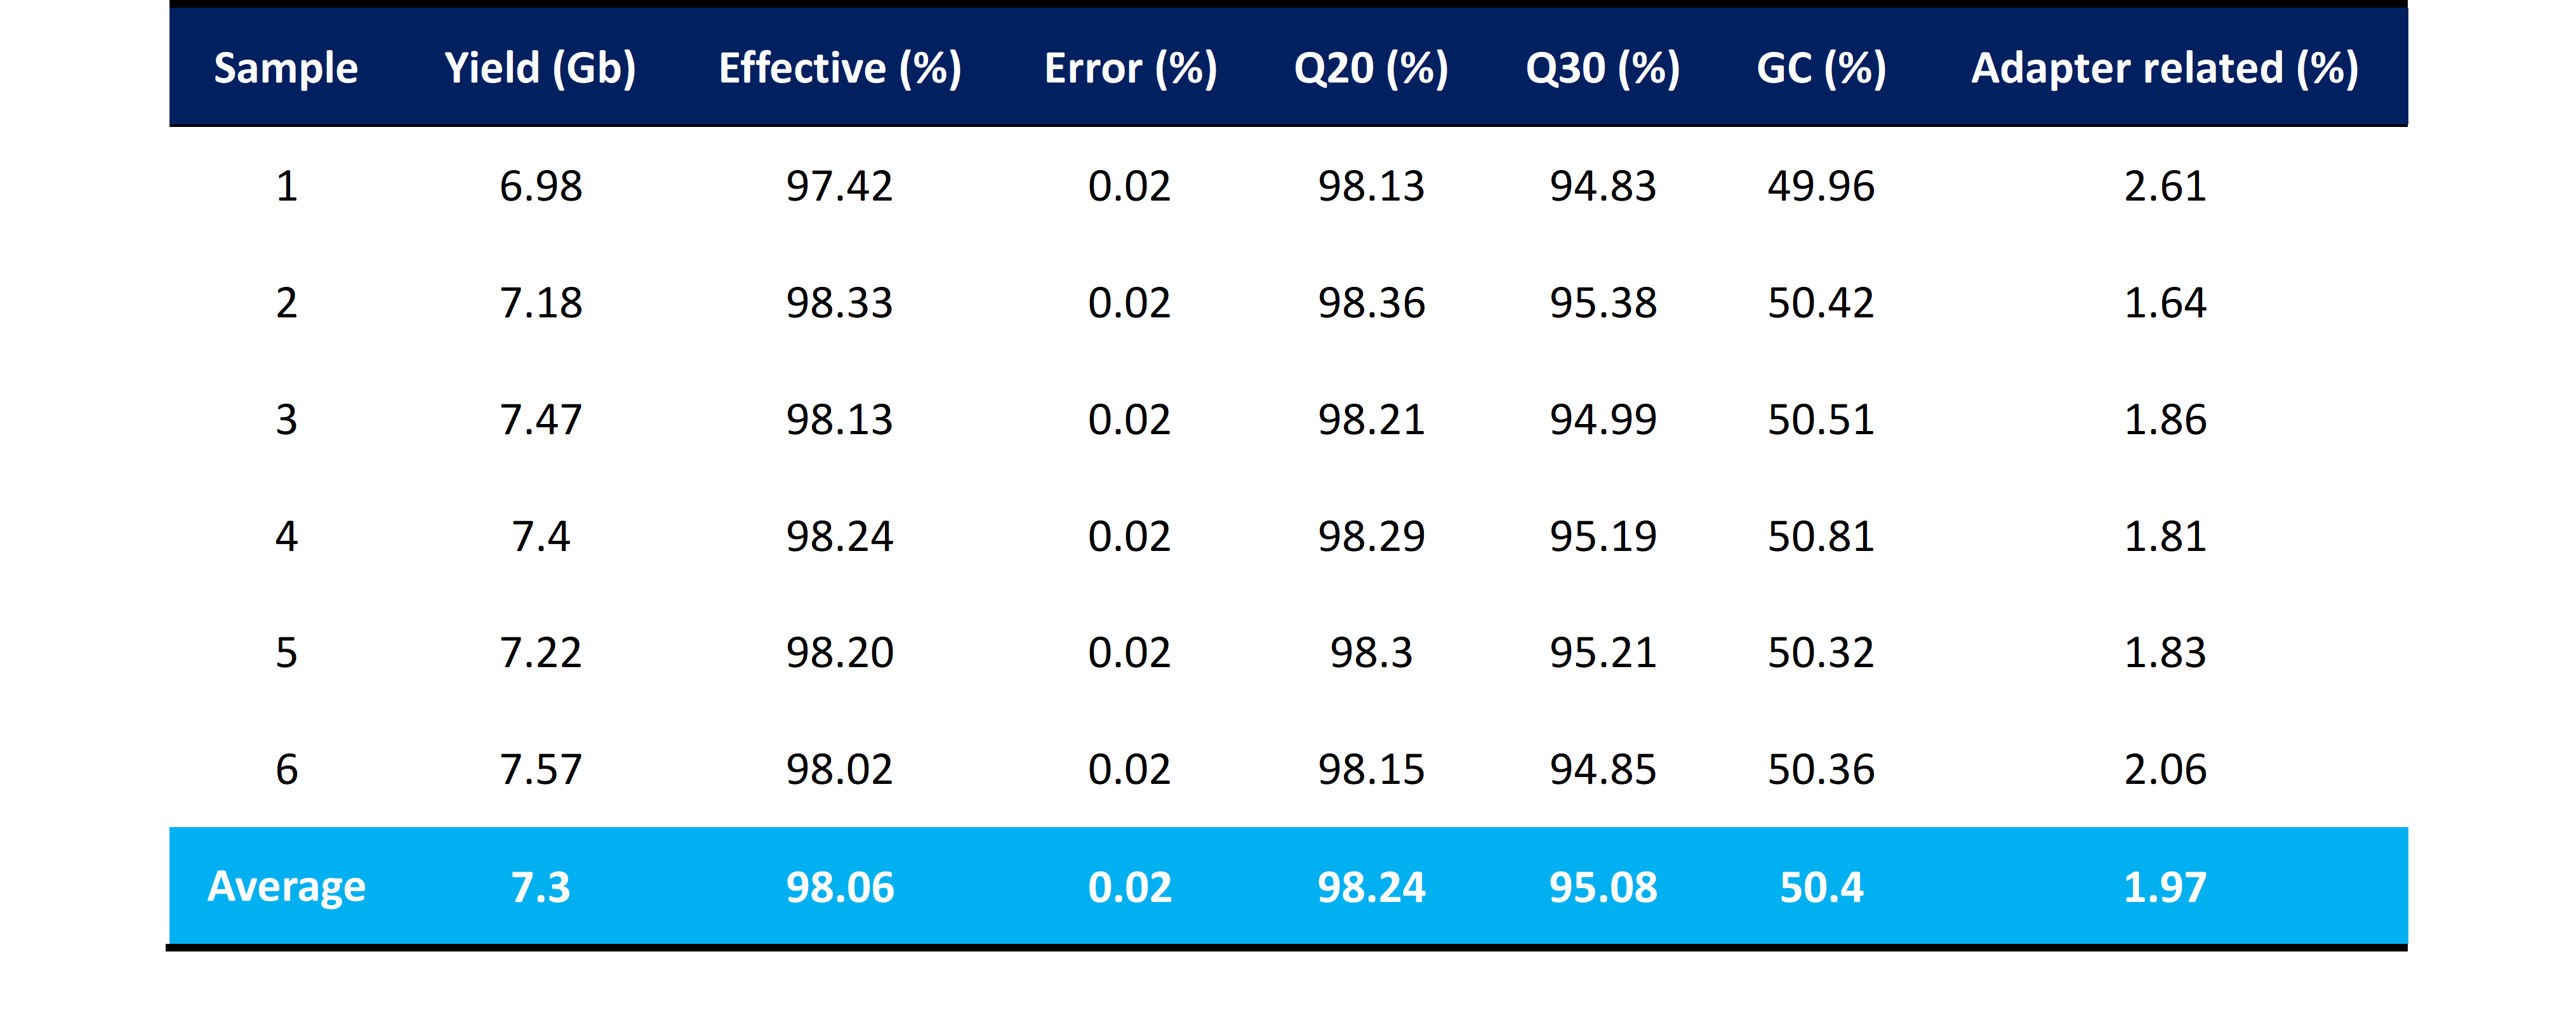
All six samples from the library were successfully retrieved with an exceptional effective rate exceeding 98%, the average Q20 and Q30 values of 98.24% and 95.08%, respectively, indicate a high accuracy of base calling and sequencing, further validating the quality of the obtained data. Notably, the average adapter percentage of only 1.97% demonstrates the efficiency of mapping reads to the reference genome. In summary, the QC metrics obtained in this experiment are comparable to those typically observed with normal RNA input amounts (Table 2).

Table 2 | Summary of quality control metrics
2

Effective rate: It represents the proportion of sequences that meet specific quality thresholds and are considered reliable for downstream analysis. Error rate: It is typically expressed as the proportion of bases that are incorrectly identified or sequenced compared to the total number of bases sequenced. Q20: Q20 represents 99% accuracy in the base call, or an error rate of 1 in 100. Q30: Q30 represents 99.9% accuracy in the base call, or an error rate of 1 in 1000.

2. AlignmentAfter quality control, the clean reads were aligned to the reference genome with HISAT2 software 2.For samples initially starting with a volume of 100 ng, the average total mapping rate was an impressive 91.04%, with a tight intra-group standard deviation of 0.24%. Furthermore, the average exon mapping rate for these samples was 90.57%, showing a high level of accuracy with a standard deviation of only 0.02% (Figure 1).

Similarly, samples with an initial volume of 50 ng exhibited an average total mapping rate of 91.77%, with an intra-group standard deviation of 0.11%. The average exon mapping rate for these samples was 90.69%, with a standard deviation of 0.20%.
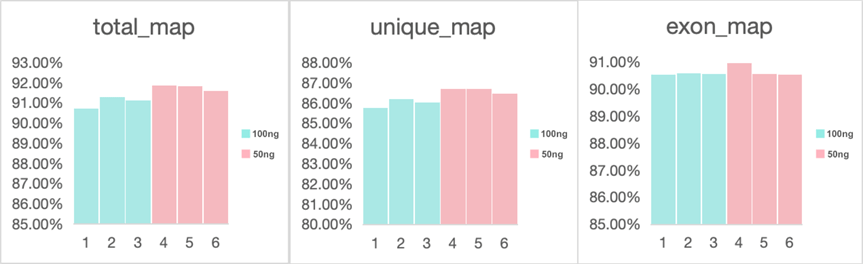
Figure 1. Mapping statistics of samples

3. Correlation analysisTo evaluate the relatedness of the samples, we performed gene expression correlation analysis. According to the Encode project, the square of the Pearson correlation coefficient (R²) should exceed 0.92 under ideal sampling and experimental conditions. Conversely, a low correlation score for certain samples may indicate the presence of poorly sequenced or outlier data 3.

We computed correlation coefficients for gene expression using normalized gene counts (measured in Fragments Per Kilobase of transcript per Million mapped reads, FPKM) within both intra-group and inter-group samples. Subsequently, we generated a heatmap to visually highlight differences between groups and the consistency within intra-group samples (Figure 2). The repeated correlation of measured data within the same RNA inputs group and the concordance across different starting inputs exceeded 0.97, indicating robust reproducibility and lack of any technical outliers.
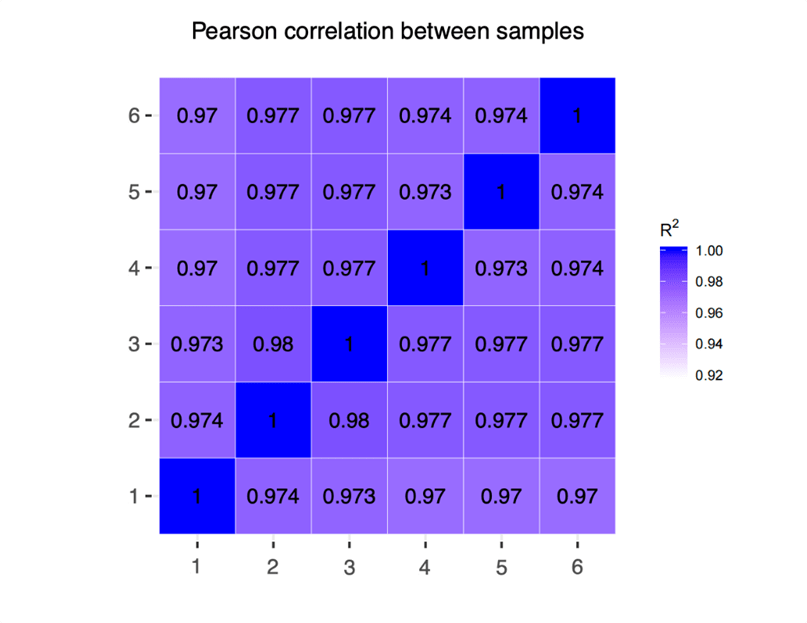
Figure 2. Heatmap of intra-group and inter-group samples

Novogene’s AdvantagesNovogene boasts extensive expertise in transcriptome sequencing projects and sample processing, having successfully conducted reference transcriptome sequencing analyses on numerous species, including humans, mice, rats, rice, Arabidopsis, tomatoes, peanuts, cotton, cucumbers, wheat, and biomedically crucial materials such as tumor cells (subcutaneous tumors), tumor-infiltrating lymphocytes, and bone marrow, among others.

The measured data from Novogene showcased a stable library construction process, robust capacity, and a high success rate for transcriptome sequencing with low starting input samples (50 ng and 100 ng). With Novogene’s expertise, your most challenging samples become opportunities to uncover valuable insights and make significant strides in your research.

Reference
  1. Adiconis X, Borges-Rivera D, Satija R, et al. Comparative analysis of RNA sequencing methods for degraded or low-input samples [published correction appears in Nat Methods. 2014 Feb;11(2):210]. Nat Methods.2013;10(7):623-629. doi:10.1038/nmeth.2483
  2. Mortazavi, A., Williams, B., McCue, K. et al. Mapping and quantifying mammalian transcriptomes by RNA-Seq.Nat Methods 5, 621–628 (2008). https://doi.org/10.1038/nmeth.1226
  3. ENCODE Project Consortium The ENCODE (ENCyclopedia of DNA elements) project. Science.2004;306(5696):636–640.

ServicesServices menu

SupportSupport menu

CompanyCompany menu

Services
Whole Genome SequencingDe novo SequencingAmplicon SequencingShotgun Metagenomic SequencingDirected DNA Methylation Sequencing (DM-Seq)mRNA SequencingSingle Cell Gene ExpressionVisium HD Spatial Gene ExpressionXenium In Situ Spatial TranscriptomeOlink ProteomicsUntargeted Metabolomics
Support
NovoMagic Bioinformatics Analysis ToolCustomer Service SystemFalcon Intelligent Delivery Platform
Company
About UsOur LocationsOur PlatformsNewsCareersContact Us
LinkedInLinkedIn hoverYouTubeYouTube hoverXX hover
Copyright © 2026 Novogene Inc. All rights reserved.For Research Use Only. Not for Clinical Diagnostic Use.
Novogene AMEA
  • Novogene AMEA
  • Genomics
    • Human Whole Genome Sequencing
    • Plant and Animal Whole Genome Sequencing
    • Microbial Whole Genome Sequencing
    • Plant and Animal De novo Sequencing
    • Microbial De novo Sequencing
    • Shotgun Metagenomics Sequencing
    • Amplicon Sequencing
    • Whole Exome Sequencing
    Transcriptomics
    • mRNA Sequencing
    • Total RNA Sequencing
    • Full-Length Transcriptome Sequencing
    • Whole Transcriptome Sequencing
    • Small RNA Sequencing
    • Circular RNA Sequencing
    • Metatranscriptome Sequencing
    • Prokaryotic RNA Sequencing
    Single Cell & Spatial Omics
    • Single Cell Gene Expression
    • Single Cell Immune Profiling Sequencing
    • Single Cell Long Read Transcriptome
    • Visium HD Spatial Gene Expression
    • Stereo-Seq Spatial Gene Expression
    • Xenium In Situ Spatial Transcriptome
    Epigenomics
    • Whole Genome Bisulfite Sequencing (WGBS)
    • Directed DNA Methylation Sequencing (DM-Seq) NEW
    • Reduced Representation Bisulfite Sequencing (RRBS)
    • Chromatin Immunoprecipitation Sequencing (ChIP-seq)
    • RNA Immunoprecipitation Sequencing (RIP-seq)
    • Assay for Transposase-Accessible Chromatin with Sequencing (ATAC-seq)

    Premade Library

    • Sequencing Only on Illumina Sequencer
    • Sequencing Only on PacBio Sequencer
    Proteomics and Metabolomics
    • Olink Proteomics
    • Quantitative Proteomics
    • Untargeted Metabolomics
  • PromotionsPromotions
    • Platforms
    • Automated Delivery Platform (Falcon)
    • Bioinformatics Analysis Tool (NovoMagic)
    • Customer Service System (CSS)
    • Brochures
    • Case Studies
    • Webinar
    • Blog
    • Sample Guidelines
    • Cancer Research
    • Immuno-oncology
    • Agrigenomics
    • Environment
    • Food Science
    • Human Microbiome
    • Plant and Animal Microbiome
    • Drug Discovery and Development
    • Rare and Complex Diseases
    • About Us
    • Our Locations
    • News
    • Careers
  • Contact UsContact Us
  1. Home
  2. Resources
  3. Blog
  4. Achieving 98% Success Rate with Minimal 100 ng RNA Samples: A Comprehensive Look at Novogene’s Standard RNA-Seq Data

Achieving 98% Success Rate with Minimal 100 ng RNA Samples: A Comprehensive Look at Novogene’s Standard RNA-Seq Data

IntroductionOver the past decade, scientists have widely used Next-Generation Sequencing (NGS) technologies for transcriptomics. With RNA sequencing (RNA-seq), researchers can accurately measure and compare gene transcriptional levels. To assess the stability of Novogene’s library construction processes for low initial RNA inputs, Novogene conducted a series of experiments utilizing the human universal reference RNA standard (UHRR, Agilent p/n 740000). This standard, widely recognized for its consistency and reliability, provided a rigorous testing ground for Novogene’s methods.

Experimental DesignThe Universal Human Reference RNA (UHRR) standard obtained from the same source was divided into six parts for the experiment (Table 1). Two groups were established, initiating with 50 ng and 100 ng, respectively. Each group consisted of three technical replicates. Short-read sequencing was employed using Illumina NovaSeq platform with paired-end 150bp (PE150) strategy, yielding 6 Gb of data per sample.

Table 1 | Sample information

Analysis Results1. Quality controlAfter preparing the library and sequencing the data, the raw data was filtered and checked for errors. The GC content was analyzed, and clean reads were then ready for further analysis. The sequencing data QC metrics reveals promising results.

All six samples from the library were successfully retrieved with an exceptional effective rate exceeding 98%, the average Q20 and Q30 values of 98.24% and 95.08%, respectively, indicate a high accuracy of base calling and sequencing, further validating the quality of the obtained data. Notably, the average adapter percentage of only 1.97% demonstrates the efficiency of mapping reads to the reference genome. In summary, the QC metrics obtained in this experiment are comparable to those typically observed with normal RNA input amounts (Table 2).

Table 2 | Summary of quality control metrics

2

Effective rate: It represents the proportion of sequences that meet specific quality thresholds and are considered reliable for downstream analysis. Error rate: It is typically expressed as the proportion of bases that are incorrectly identified or sequenced compared to the total number of bases sequenced. Q20: Q20 represents 99% accuracy in the base call, or an error rate of 1 in 100. Q30: Q30 represents 99.9% accuracy in the base call, or an error rate of 1 in 1000.

2. AlignmentAfter quality control, the clean reads were aligned to the reference genome with HISAT2 software 2.For samples initially starting with a volume of 100 ng, the average total mapping rate was an impressive 91.04%, with a tight intra-group standard deviation of 0.24%. Furthermore, the average exon mapping rate for these samples was 90.57%, showing a high level of accuracy with a standard deviation of only 0.02% (Figure 1).

Similarly, samples with an initial volume of 50 ng exhibited an average total mapping rate of 91.77%, with an intra-group standard deviation of 0.11%. The average exon mapping rate for these samples was 90.69%, with a standard deviation of 0.20%.

Figure 1. Mapping statistics of samples

3. Correlation analysisTo evaluate the relatedness of the samples, we performed gene expression correlation analysis. According to the Encode project, the square of the Pearson correlation coefficient (R²) should exceed 0.92 under ideal sampling and experimental conditions. Conversely, a low correlation score for certain samples may indicate the presence of poorly sequenced or outlier data 3.

We computed correlation coefficients for gene expression using normalized gene counts (measured in Fragments Per Kilobase of transcript per Million mapped reads, FPKM) within both intra-group and inter-group samples. Subsequently, we generated a heatmap to visually highlight differences between groups and the consistency within intra-group samples (Figure 2). The repeated correlation of measured data within the same RNA inputs group and the concordance across different starting inputs exceeded 0.97, indicating robust reproducibility and lack of any technical outliers.

Figure 2. Heatmap of intra-group and inter-group samples

Novogene’s AdvantagesNovogene boasts extensive expertise in transcriptome sequencing projects and sample processing, having successfully conducted reference transcriptome sequencing analyses on numerous species, including humans, mice, rats, rice, Arabidopsis, tomatoes, peanuts, cotton, cucumbers, wheat, and biomedically crucial materials such as tumor cells (subcutaneous tumors), tumor-infiltrating lymphocytes, and bone marrow, among others.

The measured data from Novogene showcased a stable library construction process, robust capacity, and a high success rate for transcriptome sequencing with low starting input samples (50 ng and 100 ng). With Novogene’s expertise, your most challenging samples become opportunities to uncover valuable insights and make significant strides in your research.

Reference
  1. Adiconis X, Borges-Rivera D, Satija R, et al. Comparative analysis of RNA sequencing methods for degraded or low-input samples [published correction appears in Nat Methods. 2014 Feb;11(2):210]. Nat Methods.2013;10(7):623-629. doi:10.1038/nmeth.2483
  2. Mortazavi, A., Williams, B., McCue, K. et al. Mapping and quantifying mammalian transcriptomes by RNA-Seq.Nat Methods 5, 621–628 (2008). https://doi.org/10.1038/nmeth.1226
  3. ENCODE Project Consortium The ENCODE (ENCyclopedia of DNA elements) project. Science.2004;306(5696):636–640.

ServicesServices menu

SupportSupport menu

CompanyCompany menu

Services
Whole Genome SequencingDe novo SequencingAmplicon SequencingShotgun Metagenomic SequencingDirected DNA Methylation Sequencing (DM-Seq)mRNA SequencingSingle Cell Gene ExpressionVisium HD Spatial Gene ExpressionXenium In Situ Spatial TranscriptomeOlink ProteomicsUntargeted Metabolomics
Support
NovoMagic Bioinformatics Analysis ToolCustomer Service SystemFalcon Intelligent Delivery Platform
Company
About UsOur LocationsOur PlatformsNewsCareersContact Us
LinkedInLinkedIn hoverYouTubeYouTube hoverXX hover
Copyright © 2026 Novogene Inc. All rights reserved.For Research Use Only. Not for Clinical Diagnostic Use.
Privacy PolicyCookie PolicyCareers