
Novogene AMEA
  • Novogene AMEA
  • Genomics
    • Human Whole Genome Sequencing
    • Plant and Animal Whole Genome Sequencing
    • Microbial Whole Genome Sequencing
    • Plant and Animal De novo Sequencing
    • Microbial De novo Sequencing
    • Shotgun Metagenomics Sequencing
    • Amplicon Sequencing
    • Whole Exome Sequencing
    Transcriptomics
    • mRNA Sequencing
    • Total RNA Sequencing
    • Full-Length Transcriptome Sequencing
    • Whole Transcriptome Sequencing
    • Small RNA Sequencing
    • Circular RNA Sequencing
    • Metatranscriptome Sequencing
    • Prokaryotic RNA Sequencing
    Single Cell & Spatial Omics
    • Single Cell Gene Expression
    • Single Cell Immune Profiling Sequencing
    • Single Cell Long Read Transcriptome
    • Visium HD Spatial Gene Expression
    • Stereo-Seq Spatial Gene Expression
    • Xenium In Situ Spatial Transcriptome
    Epigenomics
    • Whole Genome Bisulfite Sequencing (WGBS)
    • Directed DNA Methylation Sequencing (DM-Seq) NEW
    • Reduced Representation Bisulfite Sequencing (RRBS)
    • Chromatin Immunoprecipitation Sequencing (ChIP-seq)
    • RNA Immunoprecipitation Sequencing (RIP-seq)
    • Assay for Transposase-Accessible Chromatin with Sequencing (ATAC-seq)

    Premade Library

    • Sequencing Only on Illumina Sequencer
    • Sequencing Only on PacBio Sequencer
    Proteomics and Metabolomics
    • Olink Proteomics
    • Quantitative Proteomics
    • Untargeted Metabolomics
  • PromotionsPromotions
    • Platforms
    • Automated Delivery Platform (Falcon)
    • Bioinformatics Analysis Tool (NovoMagic)
    • Customer Service System (CSS)
    • Brochures
    • Case Studies
    • Webinar
    • Blog
    • Sample Guidelines
    • Cancer Research
    • Immuno-oncology
    • Agrigenomics
    • Environment
    • Food Science
    • Human Microbiome
    • Plant and Animal Microbiome
    • Drug Discovery and Development
    • Rare and Complex Diseases
    • About Us
    • Our Locations
    • News
    • Careers
  • Contact UsContact Us

ServicesServices menu

SupportSupport menu

CompanyCompany menu

Services
Whole Genome SequencingDe novo SequencingAmplicon SequencingShotgun Metagenomic SequencingDirected DNA Methylation Sequencing (DM-Seq)mRNA SequencingSingle Cell Gene ExpressionVisium HD Spatial Gene ExpressionXenium In Situ Spatial TranscriptomeOlink ProteomicsUntargeted Metabolomics
Support
NovoMagic Bioinformatics Analysis ToolCustomer Service SystemFalcon Intelligent Delivery Platform
Company
About UsOur LocationsOur PlatformsNewsCareersContact Us
LinkedInLinkedIn hoverYouTubeYouTube hoverXX hover
Copyright © 2026 Novogene Inc. All rights reserved.For Research Use Only. Not for Clinical Diagnostic Use.
Novogene AMEA
  • Novogene AMEA
  • Genomics
    • Human Whole Genome Sequencing
    • Plant and Animal Whole Genome Sequencing
    • Microbial Whole Genome Sequencing
    • Plant and Animal De novo Sequencing
    • Microbial De novo Sequencing
    • Shotgun Metagenomics Sequencing
    • Amplicon Sequencing
    • Whole Exome Sequencing
    Transcriptomics
    • mRNA Sequencing
    • Total RNA Sequencing
    • Full-Length Transcriptome Sequencing
    • Whole Transcriptome Sequencing
    • Small RNA Sequencing
    • Circular RNA Sequencing
    • Metatranscriptome Sequencing
    • Prokaryotic RNA Sequencing
    Single Cell & Spatial Omics
    • Single Cell Gene Expression
    • Single Cell Immune Profiling Sequencing
    • Single Cell Long Read Transcriptome
    • Visium HD Spatial Gene Expression
    • Stereo-Seq Spatial Gene Expression
    • Xenium In Situ Spatial Transcriptome
    Epigenomics
    • Whole Genome Bisulfite Sequencing (WGBS)
    • Directed DNA Methylation Sequencing (DM-Seq) NEW
    • Reduced Representation Bisulfite Sequencing (RRBS)
    • Chromatin Immunoprecipitation Sequencing (ChIP-seq)
    • RNA Immunoprecipitation Sequencing (RIP-seq)
    • Assay for Transposase-Accessible Chromatin with Sequencing (ATAC-seq)

    Premade Library

    • Sequencing Only on Illumina Sequencer
    • Sequencing Only on PacBio Sequencer
    Proteomics and Metabolomics
    • Olink Proteomics
    • Quantitative Proteomics
    • Untargeted Metabolomics
  • PromotionsPromotions
    • Platforms
    • Automated Delivery Platform (Falcon)
    • Bioinformatics Analysis Tool (NovoMagic)
    • Customer Service System (CSS)
    • Brochures
    • Case Studies
    • Webinar
    • Blog
    • Sample Guidelines
    • Cancer Research
    • Immuno-oncology
    • Agrigenomics
    • Environment
    • Food Science
    • Human Microbiome
    • Plant and Animal Microbiome
    • Drug Discovery and Development
    • Rare and Complex Diseases
    • About Us
    • Our Locations
    • News
    • Careers
  • Contact UsContact Us

ServicesServices menu

SupportSupport menu

CompanyCompany menu

Services
Whole Genome SequencingDe novo SequencingAmplicon SequencingShotgun Metagenomic SequencingDirected DNA Methylation Sequencing (DM-Seq)mRNA SequencingSingle Cell Gene ExpressionVisium HD Spatial Gene ExpressionXenium In Situ Spatial TranscriptomeOlink ProteomicsUntargeted Metabolomics
Support
NovoMagic Bioinformatics Analysis ToolCustomer Service SystemFalcon Intelligent Delivery Platform
Company
About UsOur LocationsOur PlatformsNewsCareersContact Us
LinkedInLinkedIn hoverYouTubeYouTube hoverXX hover
Copyright © 2026 Novogene Inc. All rights reserved.For Research Use Only. Not for Clinical Diagnostic Use.
banner laptop bg
banner mobile bg

Metatranscriptome Sequencing

Community-wide transcriptome profiling to characterize microbial gene expression, functional activity, and responses across complex environments.
Request a Quote
(Metatranscriptome Sequencing)
Request a Quote
(Metatranscriptome Sequencing)
OverviewOverview
BenefitsBenefits
ApplicationsApplications
SpecificationsSpecifications
ResourcesResources

Metatranscriptomics uses RNA-seq to study gene expression in microbial communities at a specific time, revealing which genes are most active. Through NGS-based, random mRNA sequencing, it provides comprehensive expression profiles, offering insights into microbial community structure, function, and adaptation.


Novogene leverages advanced Illumina NovaSeq platforms for this analysis. Using a paired-end 150-base-pair (bp) protocol, we consistently generate high-fidelity, high-quality, short-reads data. With extensive experience and substantial sequencing capacity, Novogene delivers tailored services to meet diverse research needs.

Benefits of Novogene Metatranscriptome Sequencing

Extensive Experience

Over 1 million RNA-seq samples delivered annually.

Extensive Experience

Over 1 million RNA-seq samples delivered annually.

Local Support
Local Support

Regional sequencing facilities and dedicated customer service.

Local Support
Local Support

Regional sequencing facilities and dedicated customer service.

Comprehensive Solutions

Customized workflows and bioinformatic analysis for challenging or low-input/low-quality prokaryotic samples.

Comprehensive Solutions

Customized workflows and bioinformatic analysis for challenging or low-input/low-quality prokaryotic samples.

Superior Data Quality

Consistently exceeding manufacturer performance benchmarks.

Superior Data Quality

Consistently exceeding manufacturer performance benchmarks.

Benefits of Novogene Metatranscriptome Sequencing

Extensive Experience

Over 1 million RNA-seq samples delivered annually.

Extensive Experience

Over 1 million RNA-seq samples delivered annually.

Local Support
Local Support

Regional sequencing facilities and dedicated customer service.

Local Support
Local Support

Regional sequencing facilities and dedicated customer service.

Comprehensive Solutions

Customized workflows and bioinformatic analysis for challenging or low-input/low-quality prokaryotic samples.

Comprehensive Solutions

Customized workflows and bioinformatic analysis for challenging or low-input/low-quality prokaryotic samples.

Superior Data Quality

Consistently exceeding manufacturer performance benchmarks.

Superior Data Quality

Consistently exceeding manufacturer performance benchmarks.

Applications of Metatranscriptome Sequencing

Metatranscriptomics studies the genome-wide transcriptional activity and regulatory patterns of a microbial community at a specific time and in a specific environment. It can also conduct in situ characterization of transcriptionally active bacterial taxa in microbial communities and the expression of core genes.

Microbial community analysis

Transcriptional profiling to resolve community composition, functional activity, and trait dynamics.

Microbial community analysis

Transcriptional profiling to resolve community composition, functional activity, and trait dynamics.

Pathogen detection and quantification

Identification and relative abundance estimation of target pathogens in clinical and environmental samples.

Pathogen detection and quantification

Identification and relative abundance estimation of target pathogens in clinical and environmental samples.

Transcriptionally active microbes and functional activity

Exploration of dominant/active microbial species and their functional potentials.

Transcriptionally active microbes and functional activity

Exploration of dominant/active microbial species and their functional potentials.

Core gene screening & pathway analysis

Core gene screening & functional characterization with metabolic pathway analysis.

Core gene screening & pathway analysis

Core gene screening & functional characterization with metabolic pathway analysis.

Applications of Metatranscriptome Sequencing

Metatranscriptomics studies the genome-wide transcriptional activity and regulatory patterns of a microbial community at a specific time and in a specific environment. It can also conduct in situ characterization of transcriptionally active bacterial taxa in microbial communities and the expression of core genes.

Microbial community analysis

Transcriptional profiling to resolve community composition, functional activity, and trait dynamics.

Microbial community analysis

Transcriptional profiling to resolve community composition, functional activity, and trait dynamics.

Pathogen detection and quantification

Identification and relative abundance estimation of target pathogens in clinical and environmental samples.

Pathogen detection and quantification

Identification and relative abundance estimation of target pathogens in clinical and environmental samples.

Transcriptionally active microbes and functional activity

Exploration of dominant/active microbial species and their functional potentials.

Transcriptionally active microbes and functional activity

Exploration of dominant/active microbial species and their functional potentials.

Core gene screening & pathway analysis

Core gene screening & functional characterization with metabolic pathway analysis.

Core gene screening & pathway analysis

Core gene screening & functional characterization with metabolic pathway analysis.

Specifications

Sample Requirements

Sample amounts are listed for reference only. Download the Sample Requirements to learn more. For detailed information, please contact us with your customized requests.

Library TypeSample TypeAmountVolumeConcentrationRIN (Agilent 2100)Purity
Metatranscriptome Library (double rRNA depletion)Total RNA≥ 400 ng≥ 20 μL≥ 20 ng/μL≥ 5.8, with flat baselineOD260/280
≥ 2.0;
OD260/230
≥ 2.0;
no degradation,
no contamination

Sample Requirements

Sample amounts are listed for reference only. Download the Sample Requirements to learn more. For detailed information, please contact us with your customized requests.

Library TypeSample TypeAmountVolumeConcentrationRIN (Agilent 2100)Purity
Metatranscriptome Library (double rRNA depletion)Total RNA≥ 400 ng≥ 20 μL≥ 20 ng/μL≥ 5.8, with flat baselineOD260/280
≥ 2.0;
OD260/230
≥ 2.0;
no degradation,
no contamination

Sample Requirements

Sample amounts are listed for reference only. Download the Sample Requirements to learn more. For detailed information, please contact us with your customized requests.

Library TypeSample TypeAmountVolumeConcentrationRIN (Agilent 2100)Purity
Metatranscriptome Library (double rRNA depletion)Total RNA≥ 400 ng≥ 20 μL≥ 20 ng/μL≥ 5.8, with flat baselineOD260/280
≥ 2.0;
OD260/230
≥ 2.0;
no degradation,
no contamination

Sample Requirements

Sample amounts are listed for reference only. Download the Sample Requirements to learn more. For detailed information, please contact us with your customized requests.

Library TypeSample TypeAmountVolumeConcentrationRIN (Agilent 2100)Purity
Metatranscriptome Library (double rRNA depletion)Total RNA≥ 400 ng≥ 20 μL≥ 20 ng/μL≥ 5.8, with flat baselineOD260/280
≥ 2.0;
OD260/230
≥ 2.0;
no degradation,
no contamination

Sequencing and Analysis

Recommended data outputs and analysis contents displayed are for reference only. For detailed information, please contact us with your customized requests.

Sequencing PlatformIllumina NovaSeq Platforms
Read LengthPaired-end 150bp
Recommended Data Amount≥ 20 million read pairs per sample
Content of Data AnalysisData Quality Control
Metatranscriptome Assembly
Species Annotation
Functional Annotation
Gene Expression Quantification
Differential Expression Analysis
Enrichment Analysis

Project Workflow

Our Metatranscriptome Sequencing workflow ensures high-quality results through a rigorous, step-by-step process:

Project Workflow

Sequencing and Analysis

Recommended data outputs and analysis contents displayed are for reference only. For detailed information, please contact us with your customized requests.

Sequencing PlatformIllumina NovaSeq Platforms
Read LengthPaired-end 150bp
Recommended Data Amount≥ 20 million read pairs per sample
Content of Data AnalysisData Quality Control
Metatranscriptome Assembly
Species Annotation
Functional Annotation
Gene Expression Quantification
Differential Expression Analysis
Enrichment Analysis

Project Workflow

Our Metatranscriptome Sequencing workflow ensures high-quality results through a rigorous, step-by-step process:

Project Workflow

Sequencing and Analysis

Recommended data outputs and analysis contents displayed are for reference only. For detailed information, please contact us with your customized requests.

Sequencing PlatformIllumina NovaSeq Platforms
Read LengthPaired-end 150bp
Recommended Data Amount≥ 20 million read pairs per sample
Content of Data AnalysisData Quality Control
Metatranscriptome Assembly
Species Annotation
Functional Annotation
Gene Expression Quantification
Differential Expression Analysis
Enrichment Analysis

Project Workflow

Our Metatranscriptome Sequencing workflow ensures high-quality results through a rigorous, step-by-step process:

Project Workflow

Sequencing and Analysis

Recommended data outputs and analysis contents displayed are for reference only. For detailed information, please contact us with your customized requests.

Sequencing PlatformIllumina NovaSeq Platforms
Read LengthPaired-end 150bp
Recommended Data Amount≥ 20 million read pairs per sample
Content of Data AnalysisData Quality Control
Metatranscriptome Assembly
Species Annotation
Functional Annotation
Gene Expression Quantification
Differential Expression Analysis
Enrichment Analysis

Project Workflow

Our Metatranscriptome Sequencing workflow ensures high-quality results through a rigorous, step-by-step process:

Project Workflow

Specifications

Sample Requirements

Sample amounts are listed for reference only. Download the Sample Requirements to learn more. For detailed information, please contact us with your customized requests.

Library TypeSample TypeAmountVolumeConcentrationRIN (Agilent 2100)Purity
Metatranscriptome Library (double rRNA depletion)Total RNA≥ 400 ng≥ 20 μL≥ 20 ng/μL≥ 5.8, with flat baselineOD260/280
≥ 2.0;
OD260/230
≥ 2.0;
no degradation,
no contamination

Sample Requirements

Sample amounts are listed for reference only. Download the Sample Requirements to learn more. For detailed information, please contact us with your customized requests.

Library TypeSample TypeAmountVolumeConcentrationRIN (Agilent 2100)Purity
Metatranscriptome Library (double rRNA depletion)Total RNA≥ 400 ng≥ 20 μL≥ 20 ng/μL≥ 5.8, with flat baselineOD260/280
≥ 2.0;
OD260/230
≥ 2.0;
no degradation,
no contamination

Sample Requirements

Sample amounts are listed for reference only. Download the Sample Requirements to learn more. For detailed information, please contact us with your customized requests.

Library TypeSample TypeAmountVolumeConcentrationRIN (Agilent 2100)Purity
Metatranscriptome Library (double rRNA depletion)Total RNA≥ 400 ng≥ 20 μL≥ 20 ng/μL≥ 5.8, with flat baselineOD260/280
≥ 2.0;
OD260/230
≥ 2.0;
no degradation,
no contamination

Sample Requirements

Sample amounts are listed for reference only. Download the Sample Requirements to learn more. For detailed information, please contact us with your customized requests.

Library TypeSample TypeAmountVolumeConcentrationRIN (Agilent 2100)Purity
Metatranscriptome Library (double rRNA depletion)Total RNA≥ 400 ng≥ 20 μL≥ 20 ng/μL≥ 5.8, with flat baselineOD260/280
≥ 2.0;
OD260/230
≥ 2.0;
no degradation,
no contamination

Sequencing and Analysis

Recommended data outputs and analysis contents displayed are for reference only. For detailed information, please contact us with your customized requests.

Sequencing PlatformIllumina NovaSeq Platforms
Read LengthPaired-end 150bp
Recommended Data Amount≥ 20 million read pairs per sample
Content of Data AnalysisData Quality Control
Metatranscriptome Assembly
Species Annotation
Functional Annotation
Gene Expression Quantification
Differential Expression Analysis
Enrichment Analysis

Project Workflow

Our Metatranscriptome Sequencing workflow ensures high-quality results through a rigorous, step-by-step process:

Project Workflow

Sequencing and Analysis

Recommended data outputs and analysis contents displayed are for reference only. For detailed information, please contact us with your customized requests.

Sequencing PlatformIllumina NovaSeq Platforms
Read LengthPaired-end 150bp
Recommended Data Amount≥ 20 million read pairs per sample
Content of Data AnalysisData Quality Control
Metatranscriptome Assembly
Species Annotation
Functional Annotation
Gene Expression Quantification
Differential Expression Analysis
Enrichment Analysis

Project Workflow

Our Metatranscriptome Sequencing workflow ensures high-quality results through a rigorous, step-by-step process:

Project Workflow

Sequencing and Analysis

Recommended data outputs and analysis contents displayed are for reference only. For detailed information, please contact us with your customized requests.

Sequencing PlatformIllumina NovaSeq Platforms
Read LengthPaired-end 150bp
Recommended Data Amount≥ 20 million read pairs per sample
Content of Data AnalysisData Quality Control
Metatranscriptome Assembly
Species Annotation
Functional Annotation
Gene Expression Quantification
Differential Expression Analysis
Enrichment Analysis

Project Workflow

Our Metatranscriptome Sequencing workflow ensures high-quality results through a rigorous, step-by-step process:

Project Workflow

Sequencing and Analysis

Recommended data outputs and analysis contents displayed are for reference only. For detailed information, please contact us with your customized requests.

Sequencing PlatformIllumina NovaSeq Platforms
Read LengthPaired-end 150bp
Recommended Data Amount≥ 20 million read pairs per sample
Content of Data AnalysisData Quality Control
Metatranscriptome Assembly
Species Annotation
Functional Annotation
Gene Expression Quantification
Differential Expression Analysis
Enrichment Analysis

Project Workflow

Our Metatranscriptome Sequencing workflow ensures high-quality results through a rigorous, step-by-step process:

Project Workflow

Demo Results

Image
Image
1/1
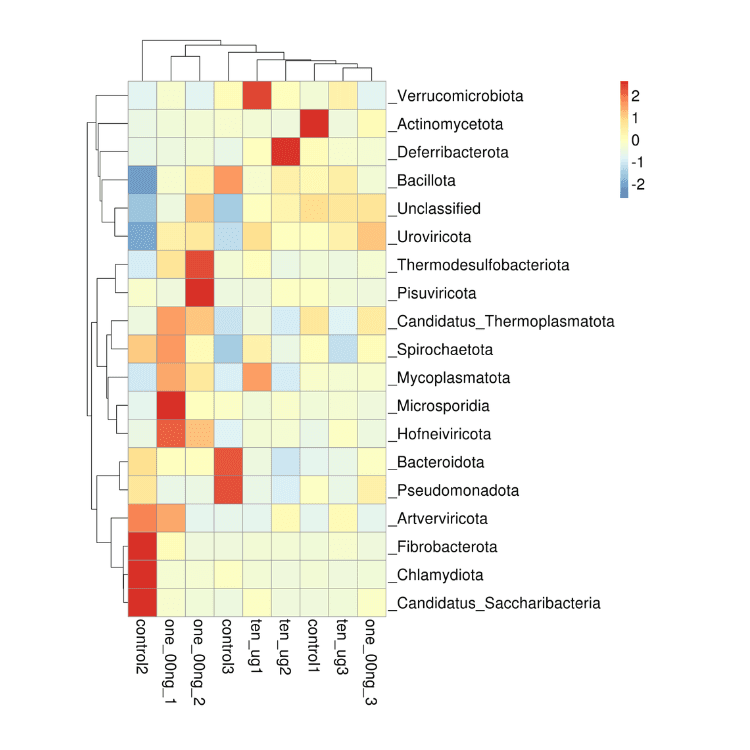
Species-abundance Clustering

This analysis clusters samples or species based on species abundance patterns to reveal similarities/differences in community composition and identify key taxa driving community structure variations.

Image
Image
1/1
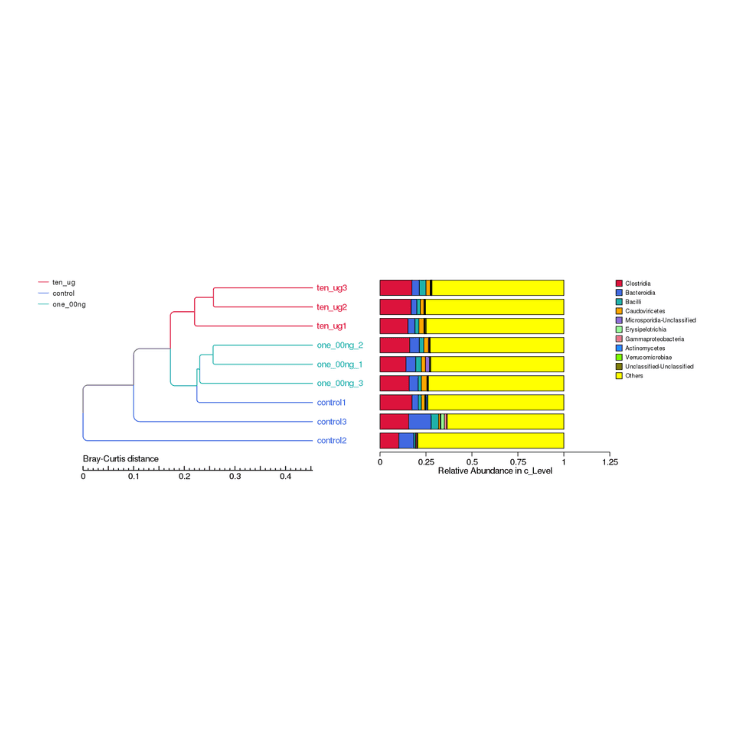
Cluster Analysis of Samples based on Species Abundance

This analysis groups samples with similar species abundance patterns to reveal potential sample associations, ecological similarities, or grouping trends related to environmental factors or experimental treatments.

Image
Image
1/1
Phylogenetic Tree of Species Differences

This tree visually illustrates evolutionary relationships and divergence patterns among species, aiding in identifying key differences in genetics, morphology, or ecology across taxa.

Image
Image
1/1
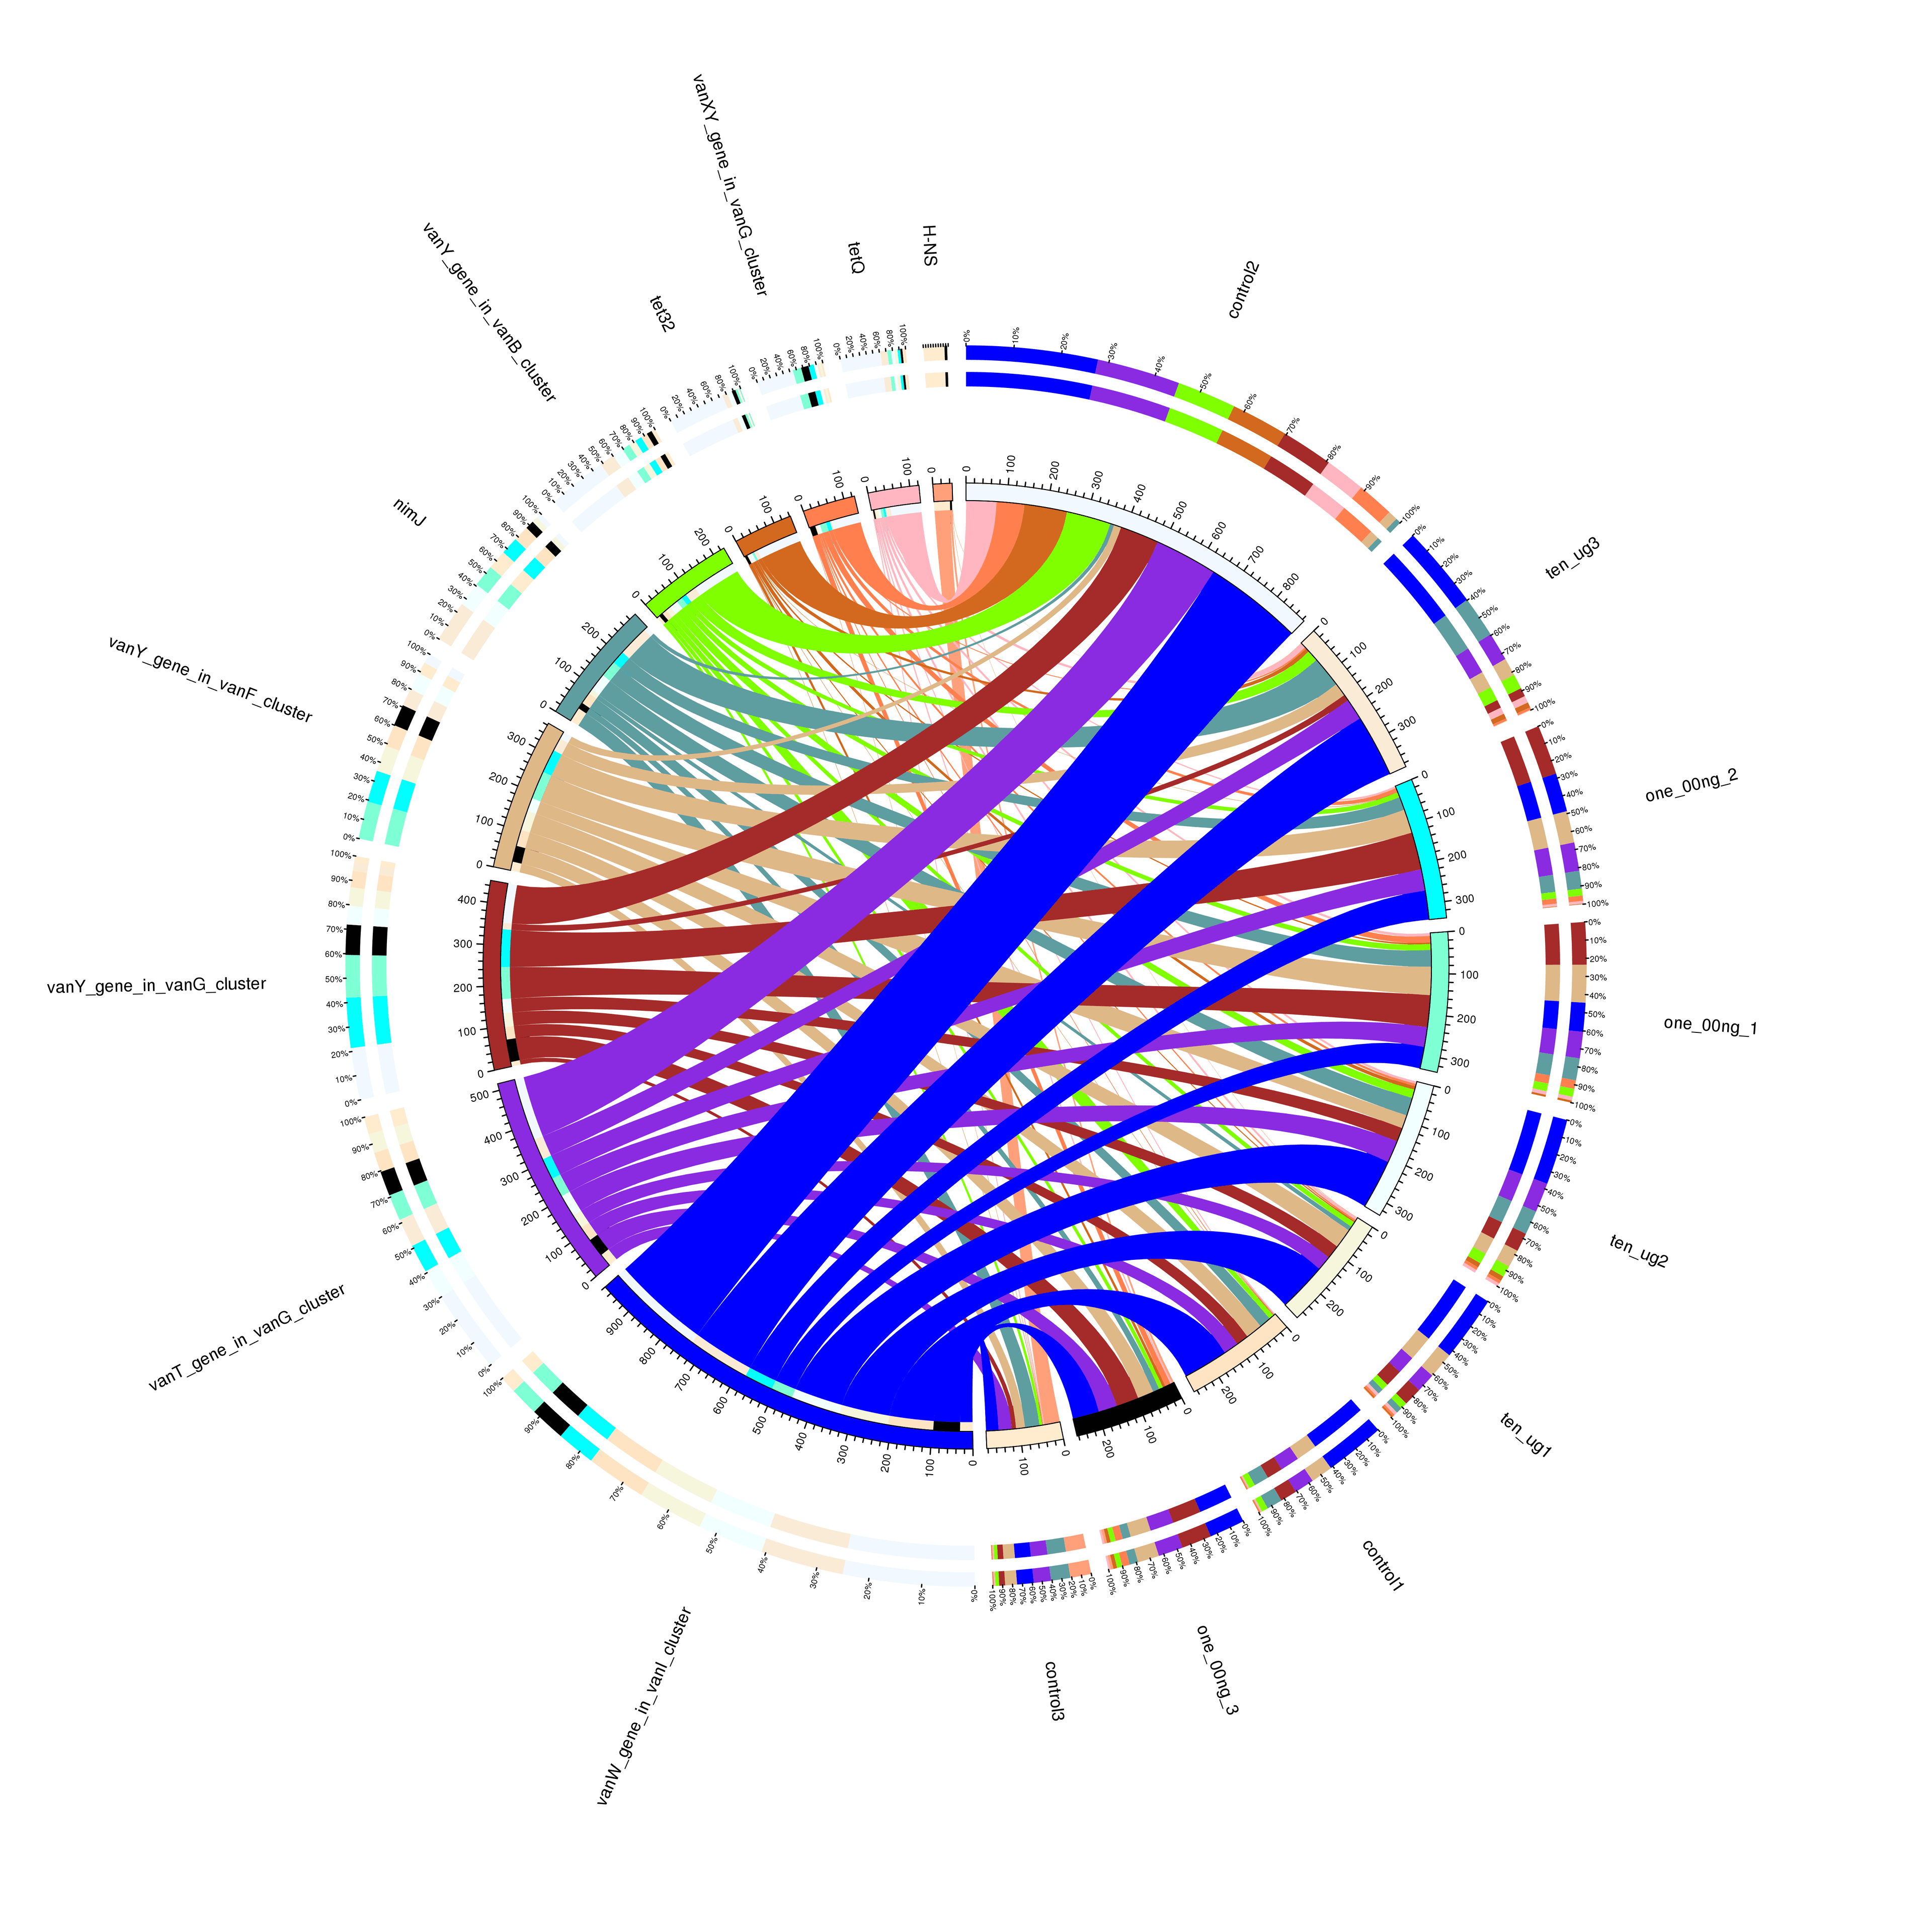
Circos Plot of ARO Abundance

This Circos plot intuitively visualizes the relative abundance and distribution patterns of Antimicrobial Resistance Genes (AROs) across samples or microbial taxa.

Image
Image
1/1
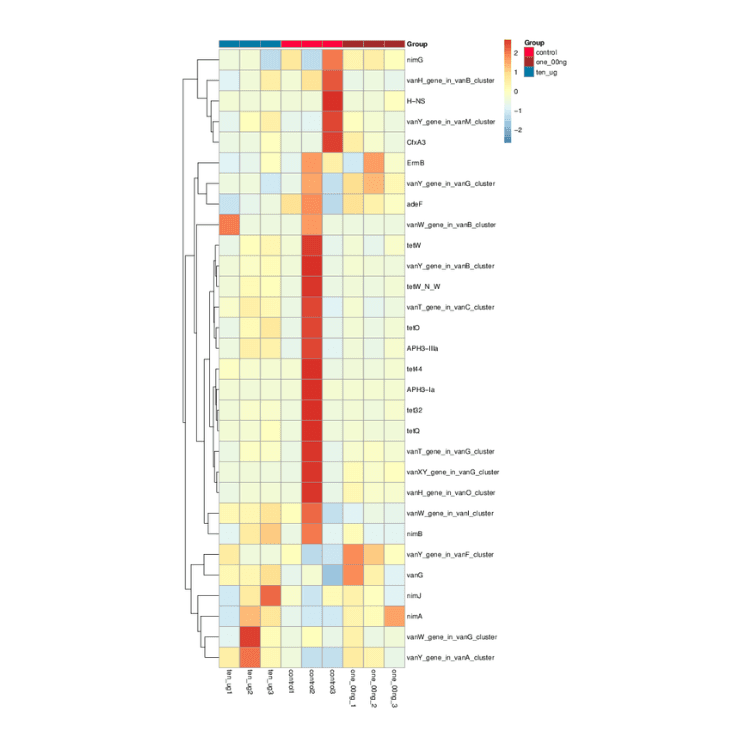
Distribution- and Abundance-based Cluster Analysis of Resistance Gene Types

This analysis clusters resistance gene types based on their distribution patterns and abundance levels to reveal associations between gene groups and environmental/biological factors, supporting resistance mechanism research.

Image
Image
1/1
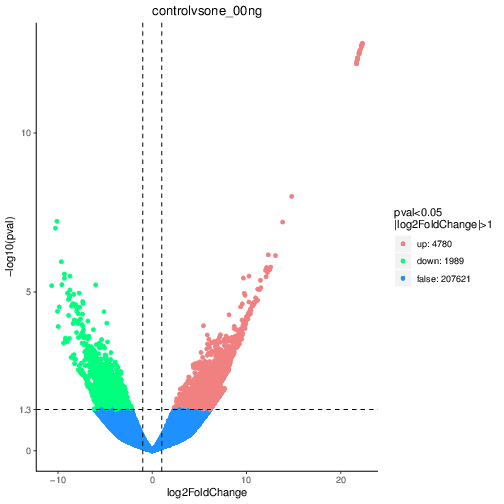
Volcano Plot of Differentially Expressed Genes

The Volcano plot of differentially expressed genes visually displays the fold change and statistical significance of gene expression differences between groups, enabling rapid identification of significantly upregulated/downregulated genes.

Image
Image
1/1
Species-abundance Clustering

This analysis clusters samples or species based on species abundance patterns to reveal similarities/differences in community composition and identify key taxa driving community structure variations.

Image
Image
1/1
Cluster Analysis of Samples based on Species Abundance

This analysis groups samples with similar species abundance patterns to reveal potential sample associations, ecological similarities, or grouping trends related to environmental factors or experimental treatments.

Image
Image
1/1
Phylogenetic Tree of Species Differences

This tree visually illustrates evolutionary relationships and divergence patterns among species, aiding in identifying key differences in genetics, morphology, or ecology across taxa.

Image
Image
1/1
Circos Plot of ARO Abundance

This Circos plot intuitively visualizes the relative abundance and distribution patterns of Antimicrobial Resistance Genes (AROs) across samples or microbial taxa.

Image
Image
1/1
Distribution- and Abundance-based Cluster Analysis of Resistance Gene Types

This analysis clusters resistance gene types based on their distribution patterns and abundance levels to reveal associations between gene groups and environmental/biological factors, supporting resistance mechanism research.

Image
Image
1/1
Volcano Plot of Differentially Expressed Genes

The Volcano plot of differentially expressed genes visually displays the fold change and statistical significance of gene expression differences between groups, enabling rapid identification of significantly upregulated/downregulated genes.

Demo Results

Image
Image
1/1
Species-abundance Clustering

This analysis clusters samples or species based on species abundance patterns to reveal similarities/differences in community composition and identify key taxa driving community structure variations.

Image
Image
1/1
Cluster Analysis of Samples based on Species Abundance

This analysis groups samples with similar species abundance patterns to reveal potential sample associations, ecological similarities, or grouping trends related to environmental factors or experimental treatments.

Image
Image
1/1
Phylogenetic Tree of Species Differences

This tree visually illustrates evolutionary relationships and divergence patterns among species, aiding in identifying key differences in genetics, morphology, or ecology across taxa.

Image
Image
1/1
Circos Plot of ARO Abundance

This Circos plot intuitively visualizes the relative abundance and distribution patterns of Antimicrobial Resistance Genes (AROs) across samples or microbial taxa.

Image
Image
1/1
Distribution- and Abundance-based Cluster Analysis of Resistance Gene Types

This analysis clusters resistance gene types based on their distribution patterns and abundance levels to reveal associations between gene groups and environmental/biological factors, supporting resistance mechanism research.

Image
Image
1/1
Volcano Plot of Differentially Expressed Genes

The Volcano plot of differentially expressed genes visually displays the fold change and statistical significance of gene expression differences between groups, enabling rapid identification of significantly upregulated/downregulated genes.

Image
Image
1/1
Species-abundance Clustering

This analysis clusters samples or species based on species abundance patterns to reveal similarities/differences in community composition and identify key taxa driving community structure variations.

Image
Image
1/1
Cluster Analysis of Samples based on Species Abundance

This analysis groups samples with similar species abundance patterns to reveal potential sample associations, ecological similarities, or grouping trends related to environmental factors or experimental treatments.

Image
Image
1/1
Phylogenetic Tree of Species Differences

This tree visually illustrates evolutionary relationships and divergence patterns among species, aiding in identifying key differences in genetics, morphology, or ecology across taxa.

Image
Image
1/1
Circos Plot of ARO Abundance

This Circos plot intuitively visualizes the relative abundance and distribution patterns of Antimicrobial Resistance Genes (AROs) across samples or microbial taxa.

Image
Image
1/1
Distribution- and Abundance-based Cluster Analysis of Resistance Gene Types

This analysis clusters resistance gene types based on their distribution patterns and abundance levels to reveal associations between gene groups and environmental/biological factors, supporting resistance mechanism research.

Image
Image
1/1
Volcano Plot of Differentially Expressed Genes

The Volcano plot of differentially expressed genes visually displays the fold change and statistical significance of gene expression differences between groups, enabling rapid identification of significantly upregulated/downregulated genes.

More Services

Shotgun Metagenomic Sequencing
(Shotgun Metagenomic Sequencing)
Shotgun Metagenomic Sequencing
(Shotgun Metagenomic Sequencing)
Amplicon Sequencing
(Amplicon Sequencing)
Amplicon Sequencing
(Amplicon Sequencing)
Microbial Whole Genome Sequencing
(Microbial Whole Genome Sequencing)
Microbial Whole Genome Sequencing
(Microbial Whole Genome Sequencing)
Microbial De novo Sequencing
(Microbial De novo Sequencing)
Microbial De novo Sequencing
(Microbial De novo Sequencing)

More Services

Shotgun Metagenomic Sequencing
(Shotgun Metagenomic Sequencing)
Shotgun Metagenomic Sequencing
(Shotgun Metagenomic Sequencing)
Amplicon Sequencing
(Amplicon Sequencing)
Amplicon Sequencing
(Amplicon Sequencing)
Microbial Whole Genome Sequencing
(Microbial Whole Genome Sequencing)
Microbial Whole Genome Sequencing
(Microbial Whole Genome Sequencing)
Microbial De novo Sequencing
(Microbial De novo Sequencing)
Microbial De novo Sequencing
(Microbial De novo Sequencing)
Background
Background

Ready to Start Your Project?

Our platform offers tailored solutions for

your unique experimental needs, ensuring a seamless experience from project design to data delivery.


Privacy PolicyCookie PolicyCareers
banner laptop bg
banner mobile bg

Metatranscriptome Sequencing

Community-wide transcriptome profiling to characterize microbial gene expression, functional activity, and responses across complex environments.
Request a Quote
(Metatranscriptome Sequencing)
Request a Quote
(Metatranscriptome Sequencing)
OverviewOverview
BenefitsBenefits
ApplicationsApplications
SpecificationsSpecifications
ResourcesResources

Metatranscriptomics uses RNA-seq to study gene expression in microbial communities at a specific time, revealing which genes are most active. Through NGS-based, random mRNA sequencing, it provides comprehensive expression profiles, offering insights into microbial community structure, function, and adaptation.


Novogene leverages advanced Illumina NovaSeq platforms for this analysis. Using a paired-end 150-base-pair (bp) protocol, we consistently generate high-fidelity, high-quality, short-reads data. With extensive experience and substantial sequencing capacity, Novogene delivers tailored services to meet diverse research needs.

Benefits of Novogene Metatranscriptome Sequencing

Extensive Experience

Over 1 million RNA-seq samples delivered annually.

Extensive Experience

Over 1 million RNA-seq samples delivered annually.

Local Support
Local Support

Regional sequencing facilities and dedicated customer service.

Local Support
Local Support

Regional sequencing facilities and dedicated customer service.

Comprehensive Solutions

Customized workflows and bioinformatic analysis for challenging or low-input/low-quality prokaryotic samples.

Comprehensive Solutions

Customized workflows and bioinformatic analysis for challenging or low-input/low-quality prokaryotic samples.

Superior Data Quality

Consistently exceeding manufacturer performance benchmarks.

Superior Data Quality

Consistently exceeding manufacturer performance benchmarks.

Benefits of Novogene Metatranscriptome Sequencing

Extensive Experience

Over 1 million RNA-seq samples delivered annually.

Extensive Experience

Over 1 million RNA-seq samples delivered annually.

Local Support
Local Support

Regional sequencing facilities and dedicated customer service.

Local Support
Local Support

Regional sequencing facilities and dedicated customer service.

Comprehensive Solutions

Customized workflows and bioinformatic analysis for challenging or low-input/low-quality prokaryotic samples.

Comprehensive Solutions

Customized workflows and bioinformatic analysis for challenging or low-input/low-quality prokaryotic samples.

Superior Data Quality

Consistently exceeding manufacturer performance benchmarks.

Superior Data Quality

Consistently exceeding manufacturer performance benchmarks.

Applications of Metatranscriptome Sequencing

Metatranscriptomics studies the genome-wide transcriptional activity and regulatory patterns of a microbial community at a specific time and in a specific environment. It can also conduct in situ characterization of transcriptionally active bacterial taxa in microbial communities and the expression of core genes.

Microbial community analysis

Transcriptional profiling to resolve community composition, functional activity, and trait dynamics.

Microbial community analysis

Transcriptional profiling to resolve community composition, functional activity, and trait dynamics.

Pathogen detection and quantification

Identification and relative abundance estimation of target pathogens in clinical and environmental samples.

Pathogen detection and quantification

Identification and relative abundance estimation of target pathogens in clinical and environmental samples.

Transcriptionally active microbes and functional activity

Exploration of dominant/active microbial species and their functional potentials.

Transcriptionally active microbes and functional activity

Exploration of dominant/active microbial species and their functional potentials.

Core gene screening & pathway analysis

Core gene screening & functional characterization with metabolic pathway analysis.

Core gene screening & pathway analysis

Core gene screening & functional characterization with metabolic pathway analysis.

Applications of Metatranscriptome Sequencing

Metatranscriptomics studies the genome-wide transcriptional activity and regulatory patterns of a microbial community at a specific time and in a specific environment. It can also conduct in situ characterization of transcriptionally active bacterial taxa in microbial communities and the expression of core genes.

Microbial community analysis

Transcriptional profiling to resolve community composition, functional activity, and trait dynamics.

Microbial community analysis

Transcriptional profiling to resolve community composition, functional activity, and trait dynamics.

Pathogen detection and quantification

Identification and relative abundance estimation of target pathogens in clinical and environmental samples.

Pathogen detection and quantification

Identification and relative abundance estimation of target pathogens in clinical and environmental samples.

Transcriptionally active microbes and functional activity

Exploration of dominant/active microbial species and their functional potentials.

Transcriptionally active microbes and functional activity

Exploration of dominant/active microbial species and their functional potentials.

Core gene screening & pathway analysis

Core gene screening & functional characterization with metabolic pathway analysis.

Core gene screening & pathway analysis

Core gene screening & functional characterization with metabolic pathway analysis.

Specifications

Sample Requirements

Sample amounts are listed for reference only. Download the Sample Requirements to learn more. For detailed information, please contact us with your customized requests.

Library TypeSample TypeAmountVolumeConcentrationRIN (Agilent 2100)Purity
Metatranscriptome Library (double rRNA depletion)Total RNA≥ 400 ng≥ 20 μL≥ 20 ng/μL≥ 5.8, with flat baselineOD260/280
≥ 2.0;
OD260/230
≥ 2.0;
no degradation,
no contamination

Sample Requirements

Sample amounts are listed for reference only. Download the Sample Requirements to learn more. For detailed information, please contact us with your customized requests.

Library TypeSample TypeAmountVolumeConcentrationRIN (Agilent 2100)Purity
Metatranscriptome Library (double rRNA depletion)Total RNA≥ 400 ng≥ 20 μL≥ 20 ng/μL≥ 5.8, with flat baselineOD260/280
≥ 2.0;
OD260/230
≥ 2.0;
no degradation,
no contamination

Sample Requirements

Sample amounts are listed for reference only. Download the Sample Requirements to learn more. For detailed information, please contact us with your customized requests.

Library TypeSample TypeAmountVolumeConcentrationRIN (Agilent 2100)Purity
Metatranscriptome Library (double rRNA depletion)Total RNA≥ 400 ng≥ 20 μL≥ 20 ng/μL≥ 5.8, with flat baselineOD260/280
≥ 2.0;
OD260/230
≥ 2.0;
no degradation,
no contamination

Sample Requirements

Sample amounts are listed for reference only. Download the Sample Requirements to learn more. For detailed information, please contact us with your customized requests.

Library TypeSample TypeAmountVolumeConcentrationRIN (Agilent 2100)Purity
Metatranscriptome Library (double rRNA depletion)Total RNA≥ 400 ng≥ 20 μL≥ 20 ng/μL≥ 5.8, with flat baselineOD260/280
≥ 2.0;
OD260/230
≥ 2.0;
no degradation,
no contamination

Sequencing and Analysis

Recommended data outputs and analysis contents displayed are for reference only. For detailed information, please contact us with your customized requests.

Sequencing PlatformIllumina NovaSeq Platforms
Read LengthPaired-end 150bp
Recommended Data Amount≥ 20 million read pairs per sample
Content of Data AnalysisData Quality Control
Metatranscriptome Assembly
Species Annotation
Functional Annotation
Gene Expression Quantification
Differential Expression Analysis
Enrichment Analysis

Project Workflow

Our Metatranscriptome Sequencing workflow ensures high-quality results through a rigorous, step-by-step process:

Project Workflow

Sequencing and Analysis

Recommended data outputs and analysis contents displayed are for reference only. For detailed information, please contact us with your customized requests.

Sequencing PlatformIllumina NovaSeq Platforms
Read LengthPaired-end 150bp
Recommended Data Amount≥ 20 million read pairs per sample
Content of Data AnalysisData Quality Control
Metatranscriptome Assembly
Species Annotation
Functional Annotation
Gene Expression Quantification
Differential Expression Analysis
Enrichment Analysis

Project Workflow

Our Metatranscriptome Sequencing workflow ensures high-quality results through a rigorous, step-by-step process:

Project Workflow

Sequencing and Analysis

Recommended data outputs and analysis contents displayed are for reference only. For detailed information, please contact us with your customized requests.

Sequencing PlatformIllumina NovaSeq Platforms
Read LengthPaired-end 150bp
Recommended Data Amount≥ 20 million read pairs per sample
Content of Data AnalysisData Quality Control
Metatranscriptome Assembly
Species Annotation
Functional Annotation
Gene Expression Quantification
Differential Expression Analysis
Enrichment Analysis

Project Workflow

Our Metatranscriptome Sequencing workflow ensures high-quality results through a rigorous, step-by-step process:

Project Workflow

Sequencing and Analysis

Recommended data outputs and analysis contents displayed are for reference only. For detailed information, please contact us with your customized requests.

Sequencing PlatformIllumina NovaSeq Platforms
Read LengthPaired-end 150bp
Recommended Data Amount≥ 20 million read pairs per sample
Content of Data AnalysisData Quality Control
Metatranscriptome Assembly
Species Annotation
Functional Annotation
Gene Expression Quantification
Differential Expression Analysis
Enrichment Analysis

Project Workflow

Our Metatranscriptome Sequencing workflow ensures high-quality results through a rigorous, step-by-step process:

Project Workflow

Specifications

Sample Requirements

Sample amounts are listed for reference only. Download the Sample Requirements to learn more. For detailed information, please contact us with your customized requests.

Library TypeSample TypeAmountVolumeConcentrationRIN (Agilent 2100)Purity
Metatranscriptome Library (double rRNA depletion)Total RNA≥ 400 ng≥ 20 μL≥ 20 ng/μL≥ 5.8, with flat baselineOD260/280
≥ 2.0;
OD260/230
≥ 2.0;
no degradation,
no contamination

Sample Requirements

Sample amounts are listed for reference only. Download the Sample Requirements to learn more. For detailed information, please contact us with your customized requests.

Library TypeSample TypeAmountVolumeConcentrationRIN (Agilent 2100)Purity
Metatranscriptome Library (double rRNA depletion)Total RNA≥ 400 ng≥ 20 μL≥ 20 ng/μL≥ 5.8, with flat baselineOD260/280
≥ 2.0;
OD260/230
≥ 2.0;
no degradation,
no contamination

Sample Requirements

Sample amounts are listed for reference only. Download the Sample Requirements to learn more. For detailed information, please contact us with your customized requests.

Library TypeSample TypeAmountVolumeConcentrationRIN (Agilent 2100)Purity
Metatranscriptome Library (double rRNA depletion)Total RNA≥ 400 ng≥ 20 μL≥ 20 ng/μL≥ 5.8, with flat baselineOD260/280
≥ 2.0;
OD260/230
≥ 2.0;
no degradation,
no contamination

Sample Requirements

Sample amounts are listed for reference only. Download the Sample Requirements to learn more. For detailed information, please contact us with your customized requests.

Library TypeSample TypeAmountVolumeConcentrationRIN (Agilent 2100)Purity
Metatranscriptome Library (double rRNA depletion)Total RNA≥ 400 ng≥ 20 μL≥ 20 ng/μL≥ 5.8, with flat baselineOD260/280
≥ 2.0;
OD260/230
≥ 2.0;
no degradation,
no contamination

Sequencing and Analysis

Recommended data outputs and analysis contents displayed are for reference only. For detailed information, please contact us with your customized requests.

Sequencing PlatformIllumina NovaSeq Platforms
Read LengthPaired-end 150bp
Recommended Data Amount≥ 20 million read pairs per sample
Content of Data AnalysisData Quality Control
Metatranscriptome Assembly
Species Annotation
Functional Annotation
Gene Expression Quantification
Differential Expression Analysis
Enrichment Analysis

Project Workflow

Our Metatranscriptome Sequencing workflow ensures high-quality results through a rigorous, step-by-step process:

Project Workflow

Sequencing and Analysis

Recommended data outputs and analysis contents displayed are for reference only. For detailed information, please contact us with your customized requests.

Sequencing PlatformIllumina NovaSeq Platforms
Read LengthPaired-end 150bp
Recommended Data Amount≥ 20 million read pairs per sample
Content of Data AnalysisData Quality Control
Metatranscriptome Assembly
Species Annotation
Functional Annotation
Gene Expression Quantification
Differential Expression Analysis
Enrichment Analysis

Project Workflow

Our Metatranscriptome Sequencing workflow ensures high-quality results through a rigorous, step-by-step process:

Project Workflow

Sequencing and Analysis

Recommended data outputs and analysis contents displayed are for reference only. For detailed information, please contact us with your customized requests.

Sequencing PlatformIllumina NovaSeq Platforms
Read LengthPaired-end 150bp
Recommended Data Amount≥ 20 million read pairs per sample
Content of Data AnalysisData Quality Control
Metatranscriptome Assembly
Species Annotation
Functional Annotation
Gene Expression Quantification
Differential Expression Analysis
Enrichment Analysis

Project Workflow

Our Metatranscriptome Sequencing workflow ensures high-quality results through a rigorous, step-by-step process:

Project Workflow

Sequencing and Analysis

Recommended data outputs and analysis contents displayed are for reference only. For detailed information, please contact us with your customized requests.

Sequencing PlatformIllumina NovaSeq Platforms
Read LengthPaired-end 150bp
Recommended Data Amount≥ 20 million read pairs per sample
Content of Data AnalysisData Quality Control
Metatranscriptome Assembly
Species Annotation
Functional Annotation
Gene Expression Quantification
Differential Expression Analysis
Enrichment Analysis

Project Workflow

Our Metatranscriptome Sequencing workflow ensures high-quality results through a rigorous, step-by-step process:

Project Workflow

Demo Results

Image
Image
1/1
Species-abundance Clustering

This analysis clusters samples or species based on species abundance patterns to reveal similarities/differences in community composition and identify key taxa driving community structure variations.

Image
Image
1/1
Cluster Analysis of Samples based on Species Abundance

This analysis groups samples with similar species abundance patterns to reveal potential sample associations, ecological similarities, or grouping trends related to environmental factors or experimental treatments.

Image
Image
1/1
Phylogenetic Tree of Species Differences

This tree visually illustrates evolutionary relationships and divergence patterns among species, aiding in identifying key differences in genetics, morphology, or ecology across taxa.

Image
Image
1/1
Circos Plot of ARO Abundance

This Circos plot intuitively visualizes the relative abundance and distribution patterns of Antimicrobial Resistance Genes (AROs) across samples or microbial taxa.

Image
Image
1/1
Distribution- and Abundance-based Cluster Analysis of Resistance Gene Types

This analysis clusters resistance gene types based on their distribution patterns and abundance levels to reveal associations between gene groups and environmental/biological factors, supporting resistance mechanism research.

Image
Image
1/1
Volcano Plot of Differentially Expressed Genes

The Volcano plot of differentially expressed genes visually displays the fold change and statistical significance of gene expression differences between groups, enabling rapid identification of significantly upregulated/downregulated genes.

Image
Image
1/1
Species-abundance Clustering

This analysis clusters samples or species based on species abundance patterns to reveal similarities/differences in community composition and identify key taxa driving community structure variations.

Image
Image
1/1
Cluster Analysis of Samples based on Species Abundance

This analysis groups samples with similar species abundance patterns to reveal potential sample associations, ecological similarities, or grouping trends related to environmental factors or experimental treatments.

Image
Image
1/1
Phylogenetic Tree of Species Differences

This tree visually illustrates evolutionary relationships and divergence patterns among species, aiding in identifying key differences in genetics, morphology, or ecology across taxa.

Image
Image
1/1
Circos Plot of ARO Abundance

This Circos plot intuitively visualizes the relative abundance and distribution patterns of Antimicrobial Resistance Genes (AROs) across samples or microbial taxa.

Image
Image
1/1
Distribution- and Abundance-based Cluster Analysis of Resistance Gene Types

This analysis clusters resistance gene types based on their distribution patterns and abundance levels to reveal associations between gene groups and environmental/biological factors, supporting resistance mechanism research.

Image
Image
1/1
Volcano Plot of Differentially Expressed Genes

The Volcano plot of differentially expressed genes visually displays the fold change and statistical significance of gene expression differences between groups, enabling rapid identification of significantly upregulated/downregulated genes.

Demo Results

Image
Image
1/1
Species-abundance Clustering

This analysis clusters samples or species based on species abundance patterns to reveal similarities/differences in community composition and identify key taxa driving community structure variations.

Image
Image
1/1
Cluster Analysis of Samples based on Species Abundance

This analysis groups samples with similar species abundance patterns to reveal potential sample associations, ecological similarities, or grouping trends related to environmental factors or experimental treatments.

Image
Image
1/1
Phylogenetic Tree of Species Differences

This tree visually illustrates evolutionary relationships and divergence patterns among species, aiding in identifying key differences in genetics, morphology, or ecology across taxa.

Image
Image
1/1
Circos Plot of ARO Abundance

This Circos plot intuitively visualizes the relative abundance and distribution patterns of Antimicrobial Resistance Genes (AROs) across samples or microbial taxa.

Image
Image
1/1
Distribution- and Abundance-based Cluster Analysis of Resistance Gene Types

This analysis clusters resistance gene types based on their distribution patterns and abundance levels to reveal associations between gene groups and environmental/biological factors, supporting resistance mechanism research.

Image
Image
1/1
Volcano Plot of Differentially Expressed Genes

The Volcano plot of differentially expressed genes visually displays the fold change and statistical significance of gene expression differences between groups, enabling rapid identification of significantly upregulated/downregulated genes.

Image
Image
1/1
Species-abundance Clustering

This analysis clusters samples or species based on species abundance patterns to reveal similarities/differences in community composition and identify key taxa driving community structure variations.

Image
Image
1/1
Cluster Analysis of Samples based on Species Abundance

This analysis groups samples with similar species abundance patterns to reveal potential sample associations, ecological similarities, or grouping trends related to environmental factors or experimental treatments.

Image
Image
1/1
Phylogenetic Tree of Species Differences

This tree visually illustrates evolutionary relationships and divergence patterns among species, aiding in identifying key differences in genetics, morphology, or ecology across taxa.

Image
Image
1/1
Circos Plot of ARO Abundance

This Circos plot intuitively visualizes the relative abundance and distribution patterns of Antimicrobial Resistance Genes (AROs) across samples or microbial taxa.

Image
Image
1/1
Distribution- and Abundance-based Cluster Analysis of Resistance Gene Types

This analysis clusters resistance gene types based on their distribution patterns and abundance levels to reveal associations between gene groups and environmental/biological factors, supporting resistance mechanism research.

Image
Image
1/1
Volcano Plot of Differentially Expressed Genes

The Volcano plot of differentially expressed genes visually displays the fold change and statistical significance of gene expression differences between groups, enabling rapid identification of significantly upregulated/downregulated genes.

More Services

Shotgun Metagenomic Sequencing
(Shotgun Metagenomic Sequencing)
Shotgun Metagenomic Sequencing
(Shotgun Metagenomic Sequencing)
Amplicon Sequencing
(Amplicon Sequencing)
Amplicon Sequencing
(Amplicon Sequencing)
Microbial Whole Genome Sequencing
(Microbial Whole Genome Sequencing)
Microbial Whole Genome Sequencing
(Microbial Whole Genome Sequencing)
Microbial De novo Sequencing
(Microbial De novo Sequencing)
Microbial De novo Sequencing
(Microbial De novo Sequencing)

More Services

Shotgun Metagenomic Sequencing
(Shotgun Metagenomic Sequencing)
Shotgun Metagenomic Sequencing
(Shotgun Metagenomic Sequencing)
Amplicon Sequencing
(Amplicon Sequencing)
Amplicon Sequencing
(Amplicon Sequencing)
Microbial Whole Genome Sequencing
(Microbial Whole Genome Sequencing)
Microbial Whole Genome Sequencing
(Microbial Whole Genome Sequencing)
Microbial De novo Sequencing
(Microbial De novo Sequencing)
Microbial De novo Sequencing
(Microbial De novo Sequencing)
Background
Background

Ready to Start Your Project?

Our platform offers tailored solutions for

your unique experimental needs, ensuring a seamless experience from project design to data delivery.


Privacy PolicyCookie PolicyCareers