
Novogene AMEA
  • Novogene AMEA
  • Genomics
    • Human Whole Genome Sequencing
    • Plant and Animal Whole Genome Sequencing
    • Microbial Whole Genome Sequencing
    • Plant and Animal De novo Sequencing
    • Microbial De novo Sequencing
    • Shotgun Metagenomics Sequencing
    • Amplicon Sequencing
    • Whole Exome Sequencing
    Transcriptomics
    • mRNA Sequencing
    • Total RNA Sequencing
    • Full-Length Transcriptome Sequencing
    • Whole Transcriptome Sequencing
    • Small RNA Sequencing
    • Circular RNA Sequencing
    • Metatranscriptome Sequencing
    • Prokaryotic RNA Sequencing
    Single Cell & Spatial Omics
    • Single Cell Gene Expression
    • Single Cell Immune Profiling Sequencing
    • Single Cell Long Read Transcriptome
    • Visium HD Spatial Gene Expression
    • Stereo-Seq Spatial Gene Expression
    • Xenium In Situ Spatial Transcriptome
    Epigenomics
    • Whole Genome Bisulfite Sequencing (WGBS)
    • Directed DNA Methylation Sequencing (DM-Seq) NEW
    • Reduced Representation Bisulfite Sequencing (RRBS)
    • Chromatin Immunoprecipitation Sequencing (ChIP-seq)
    • RNA Immunoprecipitation Sequencing (RIP-seq)
    • Assay for Transposase-Accessible Chromatin with Sequencing (ATAC-seq)

    Premade Library

    • Sequencing Only on Illumina Sequencer
    • Sequencing Only on PacBio Sequencer
    Proteomics and Metabolomics
    • Olink Proteomics
    • Quantitative Proteomics
    • Untargeted Metabolomics
  • PromotionsPromotions
    • Platforms
    • Automated Delivery Platform (Falcon)
    • Bioinformatics Analysis Tool (NovoMagic)
    • Customer Service System (CSS)
    • Brochures
    • Case Studies
    • Webinar
    • Blog
    • Sample Guidelines
    • Cancer Research
    • Immuno-oncology
    • Agrigenomics
    • Environment
    • Food Science
    • Human Microbiome
    • Plant and Animal Microbiome
    • Drug Discovery and Development
    • Rare and Complex Diseases
    • About Us
    • Our Locations
    • News
    • Careers
  • Contact UsContact Us

ServicesServices menu

SupportSupport menu

CompanyCompany menu

Services
Whole Genome SequencingDe novo SequencingAmplicon SequencingShotgun Metagenomic SequencingDirected DNA Methylation Sequencing (DM-Seq)mRNA SequencingSingle Cell Gene ExpressionVisium HD Spatial Gene ExpressionXenium In Situ Spatial TranscriptomeOlink ProteomicsUntargeted Metabolomics
Support
NovoMagic Bioinformatics Analysis ToolCustomer Service SystemFalcon Intelligent Delivery Platform
Company
About UsOur LocationsOur PlatformsNewsCareersContact Us
LinkedInLinkedIn hoverYouTubeYouTube hoverXX hover
Copyright © 2026 Novogene Inc. All rights reserved.For Research Use Only. Not for Clinical Diagnostic Use.
Novogene AMEA
  • Novogene AMEA
  • Genomics
    • Human Whole Genome Sequencing
    • Plant and Animal Whole Genome Sequencing
    • Microbial Whole Genome Sequencing
    • Plant and Animal De novo Sequencing
    • Microbial De novo Sequencing
    • Shotgun Metagenomics Sequencing
    • Amplicon Sequencing
    • Whole Exome Sequencing
    Transcriptomics
    • mRNA Sequencing
    • Total RNA Sequencing
    • Full-Length Transcriptome Sequencing
    • Whole Transcriptome Sequencing
    • Small RNA Sequencing
    • Circular RNA Sequencing
    • Metatranscriptome Sequencing
    • Prokaryotic RNA Sequencing
    Single Cell & Spatial Omics
    • Single Cell Gene Expression
    • Single Cell Immune Profiling Sequencing
    • Single Cell Long Read Transcriptome
    • Visium HD Spatial Gene Expression
    • Stereo-Seq Spatial Gene Expression
    • Xenium In Situ Spatial Transcriptome
    Epigenomics
    • Whole Genome Bisulfite Sequencing (WGBS)
    • Directed DNA Methylation Sequencing (DM-Seq) NEW
    • Reduced Representation Bisulfite Sequencing (RRBS)
    • Chromatin Immunoprecipitation Sequencing (ChIP-seq)
    • RNA Immunoprecipitation Sequencing (RIP-seq)
    • Assay for Transposase-Accessible Chromatin with Sequencing (ATAC-seq)

    Premade Library

    • Sequencing Only on Illumina Sequencer
    • Sequencing Only on PacBio Sequencer
    Proteomics and Metabolomics
    • Olink Proteomics
    • Quantitative Proteomics
    • Untargeted Metabolomics
  • PromotionsPromotions
    • Platforms
    • Automated Delivery Platform (Falcon)
    • Bioinformatics Analysis Tool (NovoMagic)
    • Customer Service System (CSS)
    • Brochures
    • Case Studies
    • Webinar
    • Blog
    • Sample Guidelines
    • Cancer Research
    • Immuno-oncology
    • Agrigenomics
    • Environment
    • Food Science
    • Human Microbiome
    • Plant and Animal Microbiome
    • Drug Discovery and Development
    • Rare and Complex Diseases
    • About Us
    • Our Locations
    • News
    • Careers
  • Contact UsContact Us

ServicesServices menu

SupportSupport menu

CompanyCompany menu

Services
Whole Genome SequencingDe novo SequencingAmplicon SequencingShotgun Metagenomic SequencingDirected DNA Methylation Sequencing (DM-Seq)mRNA SequencingSingle Cell Gene ExpressionVisium HD Spatial Gene ExpressionXenium In Situ Spatial TranscriptomeOlink ProteomicsUntargeted Metabolomics
Support
NovoMagic Bioinformatics Analysis ToolCustomer Service SystemFalcon Intelligent Delivery Platform
Company
About UsOur LocationsOur PlatformsNewsCareersContact Us
LinkedInLinkedIn hoverYouTubeYouTube hoverXX hover
Copyright © 2026 Novogene Inc. All rights reserved.For Research Use Only. Not for Clinical Diagnostic Use.
banner laptop bg
banner mobile bg

Single Cell Gene Expression

High-resolution single-cell transcriptome profiling to reveal cellular heterogeneity and gene expression dynamics across complex populations.
Request a Quote
(Single Cell Gene Expression)
Request a Quote
(Single Cell Gene Expression)
OverviewOverview
BenefitsBenefits
ApplicationsApplications
SpecificationsSpecifications
ResourcesResources

Single-cell RNA sequencing (scRNA-seq) enables the detection of cell-to-cell differences and cellular heterogeneity that are completely obscured by bulk RNA-seq. It provides high-resolution insights into gene expression at the individual cell level. With broad applications across biology and medicine, single-cell sequencing offers unprecedented understanding of cellular behavior, function, and regulation.


Powered by the 10x Genomics® Chromium™ X technology, the Illumina® NovaSeq™ X Plus platform, Novogene provides end-to-end single-cell RNA sequencing (scRNA-seq) solutions — from sample processing and library preparation to sequencing and bioinformatic analysis. Delivered with deep technical expertise and a customer-focused approach, our solutions enable high-resolution exploration of the transcriptome and immune profiling at the single-cell level.

Why Choose Novogene for Single Cell Gene Expression Sequencing?

 End-to-End Service
End-to-End Service

Seamless scRNA-seq workflow from sample processing to bioinformatics with publication-ready outputs

 End-to-End Service
End-to-End Service

Seamless scRNA-seq workflow from sample processing to bioinformatics with publication-ready outputs

Proven Expertise
Proven Expertise

High-quality results with industry-leading turnaround and extensive experience across challenging sample types

Proven Expertise
Proven Expertise

High-quality results with industry-leading turnaround and extensive experience across challenging sample types

Enhanced Sample Processing

Flexible processing including nuclei extraction and specialized frozen tissue workflows for reliable data quality

Enhanced Sample Processing

Flexible processing including nuclei extraction and specialized frozen tissue workflows for reliable data quality

Certified Excellence

10x Genomics CSP using Chromium X with GEM-X for high reproducibility, sensitivity, and efficiency.

Certified Excellence

10x Genomics CSP using Chromium X with GEM-X for high reproducibility, sensitivity, and efficiency.

 Cost-Effective Solutions
Cost-Effective Solutions

State-of-the-art high-throughput platforms and expert support delivering premium data with competitive pricing

 Cost-Effective Solutions
Cost-Effective Solutions

State-of-the-art high-throughput platforms and expert support delivering premium data with competitive pricing

Why Choose Novogene for Single Cell Gene Expression Sequencing?

 End-to-End Service
End-to-End Service

Seamless scRNA-seq workflow from sample processing to bioinformatics with publication-ready outputs

 End-to-End Service
End-to-End Service

Seamless scRNA-seq workflow from sample processing to bioinformatics with publication-ready outputs

Proven Expertise
Proven Expertise

High-quality results with industry-leading turnaround and extensive experience across challenging sample types

Proven Expertise
Proven Expertise

High-quality results with industry-leading turnaround and extensive experience across challenging sample types

Enhanced Sample Processing

Flexible processing including nuclei extraction and specialized frozen tissue workflows for reliable data quality

Enhanced Sample Processing

Flexible processing including nuclei extraction and specialized frozen tissue workflows for reliable data quality

Certified Excellence

10x Genomics CSP using Chromium X with GEM-X for high reproducibility, sensitivity, and efficiency.

Certified Excellence

10x Genomics CSP using Chromium X with GEM-X for high reproducibility, sensitivity, and efficiency.

 Cost-Effective Solutions
Cost-Effective Solutions

State-of-the-art high-throughput platforms and expert support delivering premium data with competitive pricing

 Cost-Effective Solutions
Cost-Effective Solutions

State-of-the-art high-throughput platforms and expert support delivering premium data with competitive pricing

Applications of Single Cell Gene Expression Sequencing in Research and Medicine

scRNA-seq is a powerful tool supporting a wide range of research areas, including:

Cancer Research

Uncovering cellular heterogeneity within the tumor microenvironment to reveal cancer mechanisms and potential therapeutic targets.

Cancer Research

Uncovering cellular heterogeneity within the tumor microenvironment to reveal cancer mechanisms and potential therapeutic targets.

Immunology

Mapping immune cell diversity and revealing the molecular mechanisms behind immune regulation and dysfunction.

Immunology

Mapping immune cell diversity and revealing the molecular mechanisms behind immune regulation and dysfunction.

Neuroscience

Deciphering development and regulatory networks to identify potential therapeutic targets for neurological diseases.

Neuroscience

Deciphering development and regulatory networks to identify potential therapeutic targets for neurological diseases.

Developmental Biology

Charting cell lineage and developmental trajectories to elucidate organ formation and tissue differentiation.

Developmental Biology

Charting cell lineage and developmental trajectories to elucidate organ formation and tissue differentiation.

Applications of Single Cell Gene Expression Sequencing in Research and Medicine

scRNA-seq is a powerful tool supporting a wide range of research areas, including:

Cancer Research

Uncovering cellular heterogeneity within the tumor microenvironment to reveal cancer mechanisms and potential therapeutic targets.

Cancer Research

Uncovering cellular heterogeneity within the tumor microenvironment to reveal cancer mechanisms and potential therapeutic targets.

Immunology

Mapping immune cell diversity and revealing the molecular mechanisms behind immune regulation and dysfunction.

Immunology

Mapping immune cell diversity and revealing the molecular mechanisms behind immune regulation and dysfunction.

Neuroscience

Deciphering development and regulatory networks to identify potential therapeutic targets for neurological diseases.

Neuroscience

Deciphering development and regulatory networks to identify potential therapeutic targets for neurological diseases.

Developmental Biology

Charting cell lineage and developmental trajectories to elucidate organ formation and tissue differentiation.

Developmental Biology

Charting cell lineage and developmental trajectories to elucidate organ formation and tissue differentiation.

Specifications

Sample Requirements

Sample amounts are listed for reference only. Download the Sample Requirements to learn more. For detailed information, please contact us with your customized requests.

ServiceSample Type*Sample AmountTransportation Method
scRNA-seqCryopreserved cell suspensionRecommended Amount ≥1,000,000 cells per sample;
(minimum ≥ 500,000 cells)
Needs to be shipped with dry ice
Fresh cell suspensionRecommended Amount:300,000 cells per sample;
(minimum ≥ 100,000 cells)
Needs to be shipped with ice packs within 1hr or harvest
Frozen tissue
Tissue weight ≥ 200mg
(minimum ≥ 100mg)
≥ 2 tissue pieces/sample, separate 1.5ml cryovials
Needs to be shipped with dry ice
Fresh tissueTissue weight ≥ 200mg
(minimum ≥ 100mg)
≥ 2 tissue pieces/sample, separate 1.5ml cryovials
Needs to be shipped with ice packs within 48hrs of harvest
*Sample type preferences may vary based on sequencing requirements and sample compatibility.

Sample Requirements

Sample amounts are listed for reference only. Download the Sample Requirements to learn more. For detailed information, please contact us with your customized requests.

ServiceSample Type*Sample AmountTransportation Method
scRNA-seqCryopreserved cell suspensionRecommended Amount ≥1,000,000 cells per sample;
(minimum ≥ 500,000 cells)
Needs to be shipped with dry ice
Fresh cell suspensionRecommended Amount:300,000 cells per sample;
(minimum ≥ 100,000 cells)
Needs to be shipped with ice packs within 1hr or harvest
Frozen tissue
Tissue weight ≥ 200mg
(minimum ≥ 100mg)
≥ 2 tissue pieces/sample, separate 1.5ml cryovials
Needs to be shipped with dry ice
Fresh tissueTissue weight ≥ 200mg
(minimum ≥ 100mg)
≥ 2 tissue pieces/sample, separate 1.5ml cryovials
Needs to be shipped with ice packs within 48hrs of harvest
*Sample type preferences may vary based on sequencing requirements and sample compatibility.

Sample Requirements

Sample amounts are listed for reference only. Download the Sample Requirements to learn more. For detailed information, please contact us with your customized requests.

ServiceSample Type*Sample AmountTransportation Method
scRNA-seqCryopreserved cell suspensionRecommended Amount ≥1,000,000 cells per sample;
(minimum ≥ 500,000 cells)
Needs to be shipped with dry ice
Fresh cell suspensionRecommended Amount:300,000 cells per sample;
(minimum ≥ 100,000 cells)
Needs to be shipped with ice packs within 1hr or harvest
Frozen tissue
Tissue weight ≥ 200mg
(minimum ≥ 100mg)
≥ 2 tissue pieces/sample, separate 1.5ml cryovials
Needs to be shipped with dry ice
Fresh tissueTissue weight ≥ 200mg
(minimum ≥ 100mg)
≥ 2 tissue pieces/sample, separate 1.5ml cryovials
Needs to be shipped with ice packs within 48hrs of harvest
*Sample type preferences may vary based on sequencing requirements and sample compatibility.

Sample Requirements

Sample amounts are listed for reference only. Download the Sample Requirements to learn more. For detailed information, please contact us with your customized requests.

ServiceSample Type*Sample AmountTransportation Method
scRNA-seqCryopreserved cell suspensionRecommended Amount ≥1,000,000 cells per sample;
(minimum ≥ 500,000 cells)
Needs to be shipped with dry ice
Fresh cell suspensionRecommended Amount:300,000 cells per sample;
(minimum ≥ 100,000 cells)
Needs to be shipped with ice packs within 1hr or harvest
Frozen tissue
Tissue weight ≥ 200mg
(minimum ≥ 100mg)
≥ 2 tissue pieces/sample, separate 1.5ml cryovials
Needs to be shipped with dry ice
Fresh tissueTissue weight ≥ 200mg
(minimum ≥ 100mg)
≥ 2 tissue pieces/sample, separate 1.5ml cryovials
Needs to be shipped with ice packs within 48hrs of harvest
*Sample type preferences may vary based on sequencing requirements and sample compatibility.

Sequencing and Analysis

Recommended data outputs and analysis contents displayed are for reference only. For detailed information, please contact us with your customized requests.

Sequencing PlatformIllumina NovaSeq X-Plus Sequencing Platform
Read LengthPaired-end 150 bp
Recommended Data20,000 – 50,000 read pairs/cell, 100-120Gb/sample
AnalysisCell Ranger Analysis
Demultiplex BCL files from a sequencer into FASTQs.
Summary metrics (sequencing quality, number of cells detected, the mean reads per cell, and the median genes detected per cell et al.).
Alignment of reads to genome.
Gene expression quantification.
Clustering analysis.
Differentially expression analysis between clusters.
Visualization.
Standard Analysis
Demultiplex BCL files from a sequencer into FASTQs. Alignment, UMI counting, Metrics summary.
Identification of highly variable gene (HVGs).
Cell Subpopulation Identification.
Principal component analysis (PCA).
Identify clusters of cells.
Dimensionality reduction and Visualization.
Marker gene detection (Differentially expression analysis between clusters).
GO/KEGG/Reactome Enrichment.
FunctionalAnnotation of Transcription Factor.
Protein-Protein Interaction Network Analysis.

Project Workflow

We support an end-to-end suite of services to ensure that our clients gets the best quality data. This includes a pre-project consultation with our application experts in experimental design, subsequent sample preparation, library construction, sequencing, and bioinformatics analysis.

Project Workflow

Sequencing and Analysis

Recommended data outputs and analysis contents displayed are for reference only. For detailed information, please contact us with your customized requests.

Sequencing PlatformIllumina NovaSeq X-Plus Sequencing Platform
Read LengthPaired-end 150 bp
Recommended Data20,000 – 50,000 read pairs/cell, 100-120Gb/sample
AnalysisCell Ranger Analysis
Demultiplex BCL files from a sequencer into FASTQs.
Summary metrics (sequencing quality, number of cells detected, the mean reads per cell, and the median genes detected per cell et al.).
Alignment of reads to genome.
Gene expression quantification.
Clustering analysis.
Differentially expression analysis between clusters.
Visualization.
Standard Analysis
Demultiplex BCL files from a sequencer into FASTQs. Alignment, UMI counting, Metrics summary.
Identification of highly variable gene (HVGs).
Cell Subpopulation Identification.
Principal component analysis (PCA).
Identify clusters of cells.
Dimensionality reduction and Visualization.
Marker gene detection (Differentially expression analysis between clusters).
GO/KEGG/Reactome Enrichment.
FunctionalAnnotation of Transcription Factor.
Protein-Protein Interaction Network Analysis.

Project Workflow

We support an end-to-end suite of services to ensure that our clients gets the best quality data. This includes a pre-project consultation with our application experts in experimental design, subsequent sample preparation, library construction, sequencing, and bioinformatics analysis.

Project Workflow

Sequencing and Analysis

Recommended data outputs and analysis contents displayed are for reference only. For detailed information, please contact us with your customized requests.

Sequencing PlatformIllumina NovaSeq X-Plus Sequencing Platform
Read LengthPaired-end 150 bp
Recommended Data20,000 – 50,000 read pairs/cell, 100-120Gb/sample
AnalysisCell Ranger Analysis
Demultiplex BCL files from a sequencer into FASTQs.
Summary metrics (sequencing quality, number of cells detected, the mean reads per cell, and the median genes detected per cell et al.).
Alignment of reads to genome.
Gene expression quantification.
Clustering analysis.
Differentially expression analysis between clusters.
Visualization.
Standard Analysis
Demultiplex BCL files from a sequencer into FASTQs. Alignment, UMI counting, Metrics summary.
Identification of highly variable gene (HVGs).
Cell Subpopulation Identification.
Principal component analysis (PCA).
Identify clusters of cells.
Dimensionality reduction and Visualization.
Marker gene detection (Differentially expression analysis between clusters).
GO/KEGG/Reactome Enrichment.
FunctionalAnnotation of Transcription Factor.
Protein-Protein Interaction Network Analysis.

Project Workflow

We support an end-to-end suite of services to ensure that our clients gets the best quality data. This includes a pre-project consultation with our application experts in experimental design, subsequent sample preparation, library construction, sequencing, and bioinformatics analysis.

Project Workflow

Sequencing and Analysis

Recommended data outputs and analysis contents displayed are for reference only. For detailed information, please contact us with your customized requests.

Sequencing PlatformIllumina NovaSeq X-Plus Sequencing Platform
Read LengthPaired-end 150 bp
Recommended Data20,000 – 50,000 read pairs/cell, 100-120Gb/sample
AnalysisCell Ranger Analysis
Demultiplex BCL files from a sequencer into FASTQs.
Summary metrics (sequencing quality, number of cells detected, the mean reads per cell, and the median genes detected per cell et al.).
Alignment of reads to genome.
Gene expression quantification.
Clustering analysis.
Differentially expression analysis between clusters.
Visualization.
Standard Analysis
Demultiplex BCL files from a sequencer into FASTQs. Alignment, UMI counting, Metrics summary.
Identification of highly variable gene (HVGs).
Cell Subpopulation Identification.
Principal component analysis (PCA).
Identify clusters of cells.
Dimensionality reduction and Visualization.
Marker gene detection (Differentially expression analysis between clusters).
GO/KEGG/Reactome Enrichment.
FunctionalAnnotation of Transcription Factor.
Protein-Protein Interaction Network Analysis.

Project Workflow

We support an end-to-end suite of services to ensure that our clients gets the best quality data. This includes a pre-project consultation with our application experts in experimental design, subsequent sample preparation, library construction, sequencing, and bioinformatics analysis.

Project Workflow

Specifications

Sample Requirements

Sample amounts are listed for reference only. Download the Sample Requirements to learn more. For detailed information, please contact us with your customized requests.

ServiceSample Type*Sample AmountTransportation Method
scRNA-seqCryopreserved cell suspensionRecommended Amount ≥1,000,000 cells per sample;
(minimum ≥ 500,000 cells)
Needs to be shipped with dry ice
Fresh cell suspensionRecommended Amount:300,000 cells per sample;
(minimum ≥ 100,000 cells)
Needs to be shipped with ice packs within 1hr or harvest
Frozen tissue
Tissue weight ≥ 200mg
(minimum ≥ 100mg)
≥ 2 tissue pieces/sample, separate 1.5ml cryovials
Needs to be shipped with dry ice
Fresh tissueTissue weight ≥ 200mg
(minimum ≥ 100mg)
≥ 2 tissue pieces/sample, separate 1.5ml cryovials
Needs to be shipped with ice packs within 48hrs of harvest
*Sample type preferences may vary based on sequencing requirements and sample compatibility.

Sample Requirements

Sample amounts are listed for reference only. Download the Sample Requirements to learn more. For detailed information, please contact us with your customized requests.

ServiceSample Type*Sample AmountTransportation Method
scRNA-seqCryopreserved cell suspensionRecommended Amount ≥1,000,000 cells per sample;
(minimum ≥ 500,000 cells)
Needs to be shipped with dry ice
Fresh cell suspensionRecommended Amount:300,000 cells per sample;
(minimum ≥ 100,000 cells)
Needs to be shipped with ice packs within 1hr or harvest
Frozen tissue
Tissue weight ≥ 200mg
(minimum ≥ 100mg)
≥ 2 tissue pieces/sample, separate 1.5ml cryovials
Needs to be shipped with dry ice
Fresh tissueTissue weight ≥ 200mg
(minimum ≥ 100mg)
≥ 2 tissue pieces/sample, separate 1.5ml cryovials
Needs to be shipped with ice packs within 48hrs of harvest
*Sample type preferences may vary based on sequencing requirements and sample compatibility.

Sample Requirements

Sample amounts are listed for reference only. Download the Sample Requirements to learn more. For detailed information, please contact us with your customized requests.

ServiceSample Type*Sample AmountTransportation Method
scRNA-seqCryopreserved cell suspensionRecommended Amount ≥1,000,000 cells per sample;
(minimum ≥ 500,000 cells)
Needs to be shipped with dry ice
Fresh cell suspensionRecommended Amount:300,000 cells per sample;
(minimum ≥ 100,000 cells)
Needs to be shipped with ice packs within 1hr or harvest
Frozen tissue
Tissue weight ≥ 200mg
(minimum ≥ 100mg)
≥ 2 tissue pieces/sample, separate 1.5ml cryovials
Needs to be shipped with dry ice
Fresh tissueTissue weight ≥ 200mg
(minimum ≥ 100mg)
≥ 2 tissue pieces/sample, separate 1.5ml cryovials
Needs to be shipped with ice packs within 48hrs of harvest
*Sample type preferences may vary based on sequencing requirements and sample compatibility.

Sample Requirements

Sample amounts are listed for reference only. Download the Sample Requirements to learn more. For detailed information, please contact us with your customized requests.

ServiceSample Type*Sample AmountTransportation Method
scRNA-seqCryopreserved cell suspensionRecommended Amount ≥1,000,000 cells per sample;
(minimum ≥ 500,000 cells)
Needs to be shipped with dry ice
Fresh cell suspensionRecommended Amount:300,000 cells per sample;
(minimum ≥ 100,000 cells)
Needs to be shipped with ice packs within 1hr or harvest
Frozen tissue
Tissue weight ≥ 200mg
(minimum ≥ 100mg)
≥ 2 tissue pieces/sample, separate 1.5ml cryovials
Needs to be shipped with dry ice
Fresh tissueTissue weight ≥ 200mg
(minimum ≥ 100mg)
≥ 2 tissue pieces/sample, separate 1.5ml cryovials
Needs to be shipped with ice packs within 48hrs of harvest
*Sample type preferences may vary based on sequencing requirements and sample compatibility.

Sequencing and Analysis

Recommended data outputs and analysis contents displayed are for reference only. For detailed information, please contact us with your customized requests.

Sequencing PlatformIllumina NovaSeq X-Plus Sequencing Platform
Read LengthPaired-end 150 bp
Recommended Data20,000 – 50,000 read pairs/cell, 100-120Gb/sample
AnalysisCell Ranger Analysis
Demultiplex BCL files from a sequencer into FASTQs.
Summary metrics (sequencing quality, number of cells detected, the mean reads per cell, and the median genes detected per cell et al.).
Alignment of reads to genome.
Gene expression quantification.
Clustering analysis.
Differentially expression analysis between clusters.
Visualization.
Standard Analysis
Demultiplex BCL files from a sequencer into FASTQs. Alignment, UMI counting, Metrics summary.
Identification of highly variable gene (HVGs).
Cell Subpopulation Identification.
Principal component analysis (PCA).
Identify clusters of cells.
Dimensionality reduction and Visualization.
Marker gene detection (Differentially expression analysis between clusters).
GO/KEGG/Reactome Enrichment.
FunctionalAnnotation of Transcription Factor.
Protein-Protein Interaction Network Analysis.

Project Workflow

We support an end-to-end suite of services to ensure that our clients gets the best quality data. This includes a pre-project consultation with our application experts in experimental design, subsequent sample preparation, library construction, sequencing, and bioinformatics analysis.

Project Workflow

Sequencing and Analysis

Recommended data outputs and analysis contents displayed are for reference only. For detailed information, please contact us with your customized requests.

Sequencing PlatformIllumina NovaSeq X-Plus Sequencing Platform
Read LengthPaired-end 150 bp
Recommended Data20,000 – 50,000 read pairs/cell, 100-120Gb/sample
AnalysisCell Ranger Analysis
Demultiplex BCL files from a sequencer into FASTQs.
Summary metrics (sequencing quality, number of cells detected, the mean reads per cell, and the median genes detected per cell et al.).
Alignment of reads to genome.
Gene expression quantification.
Clustering analysis.
Differentially expression analysis between clusters.
Visualization.
Standard Analysis
Demultiplex BCL files from a sequencer into FASTQs. Alignment, UMI counting, Metrics summary.
Identification of highly variable gene (HVGs).
Cell Subpopulation Identification.
Principal component analysis (PCA).
Identify clusters of cells.
Dimensionality reduction and Visualization.
Marker gene detection (Differentially expression analysis between clusters).
GO/KEGG/Reactome Enrichment.
FunctionalAnnotation of Transcription Factor.
Protein-Protein Interaction Network Analysis.

Project Workflow

We support an end-to-end suite of services to ensure that our clients gets the best quality data. This includes a pre-project consultation with our application experts in experimental design, subsequent sample preparation, library construction, sequencing, and bioinformatics analysis.

Project Workflow

Sequencing and Analysis

Recommended data outputs and analysis contents displayed are for reference only. For detailed information, please contact us with your customized requests.

Sequencing PlatformIllumina NovaSeq X-Plus Sequencing Platform
Read LengthPaired-end 150 bp
Recommended Data20,000 – 50,000 read pairs/cell, 100-120Gb/sample
AnalysisCell Ranger Analysis
Demultiplex BCL files from a sequencer into FASTQs.
Summary metrics (sequencing quality, number of cells detected, the mean reads per cell, and the median genes detected per cell et al.).
Alignment of reads to genome.
Gene expression quantification.
Clustering analysis.
Differentially expression analysis between clusters.
Visualization.
Standard Analysis
Demultiplex BCL files from a sequencer into FASTQs. Alignment, UMI counting, Metrics summary.
Identification of highly variable gene (HVGs).
Cell Subpopulation Identification.
Principal component analysis (PCA).
Identify clusters of cells.
Dimensionality reduction and Visualization.
Marker gene detection (Differentially expression analysis between clusters).
GO/KEGG/Reactome Enrichment.
FunctionalAnnotation of Transcription Factor.
Protein-Protein Interaction Network Analysis.

Project Workflow

We support an end-to-end suite of services to ensure that our clients gets the best quality data. This includes a pre-project consultation with our application experts in experimental design, subsequent sample preparation, library construction, sequencing, and bioinformatics analysis.

Project Workflow

Sequencing and Analysis

Recommended data outputs and analysis contents displayed are for reference only. For detailed information, please contact us with your customized requests.

Sequencing PlatformIllumina NovaSeq X-Plus Sequencing Platform
Read LengthPaired-end 150 bp
Recommended Data20,000 – 50,000 read pairs/cell, 100-120Gb/sample
AnalysisCell Ranger Analysis
Demultiplex BCL files from a sequencer into FASTQs.
Summary metrics (sequencing quality, number of cells detected, the mean reads per cell, and the median genes detected per cell et al.).
Alignment of reads to genome.
Gene expression quantification.
Clustering analysis.
Differentially expression analysis between clusters.
Visualization.
Standard Analysis
Demultiplex BCL files from a sequencer into FASTQs. Alignment, UMI counting, Metrics summary.
Identification of highly variable gene (HVGs).
Cell Subpopulation Identification.
Principal component analysis (PCA).
Identify clusters of cells.
Dimensionality reduction and Visualization.
Marker gene detection (Differentially expression analysis between clusters).
GO/KEGG/Reactome Enrichment.
FunctionalAnnotation of Transcription Factor.
Protein-Protein Interaction Network Analysis.

Project Workflow

We support an end-to-end suite of services to ensure that our clients gets the best quality data. This includes a pre-project consultation with our application experts in experimental design, subsequent sample preparation, library construction, sequencing, and bioinformatics analysis.

Project Workflow

Demo Results

Image
Image
Image
Image
1/2
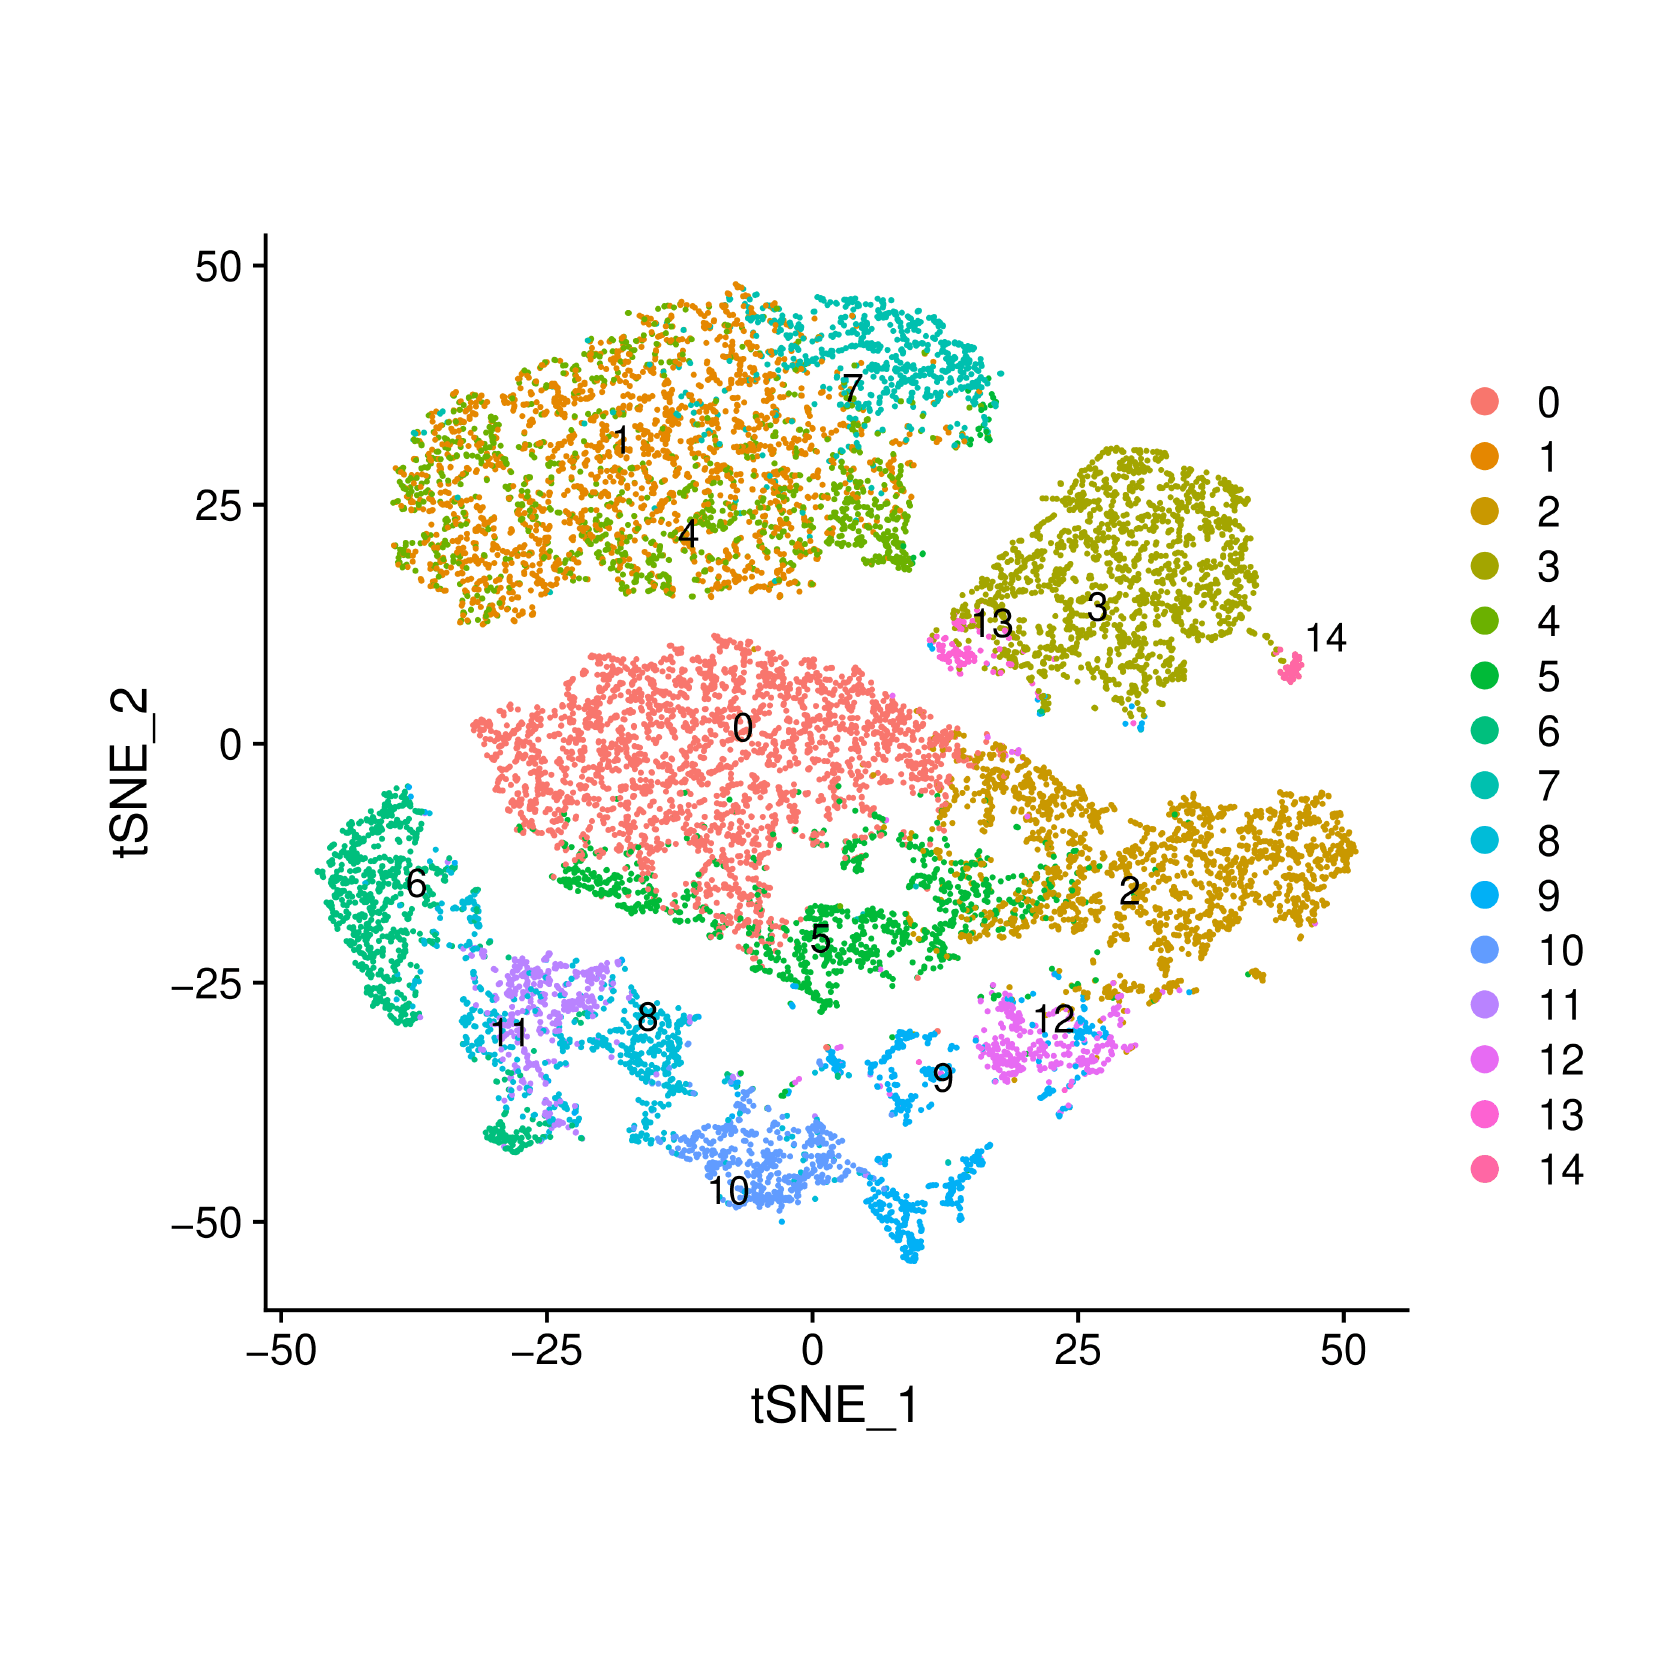
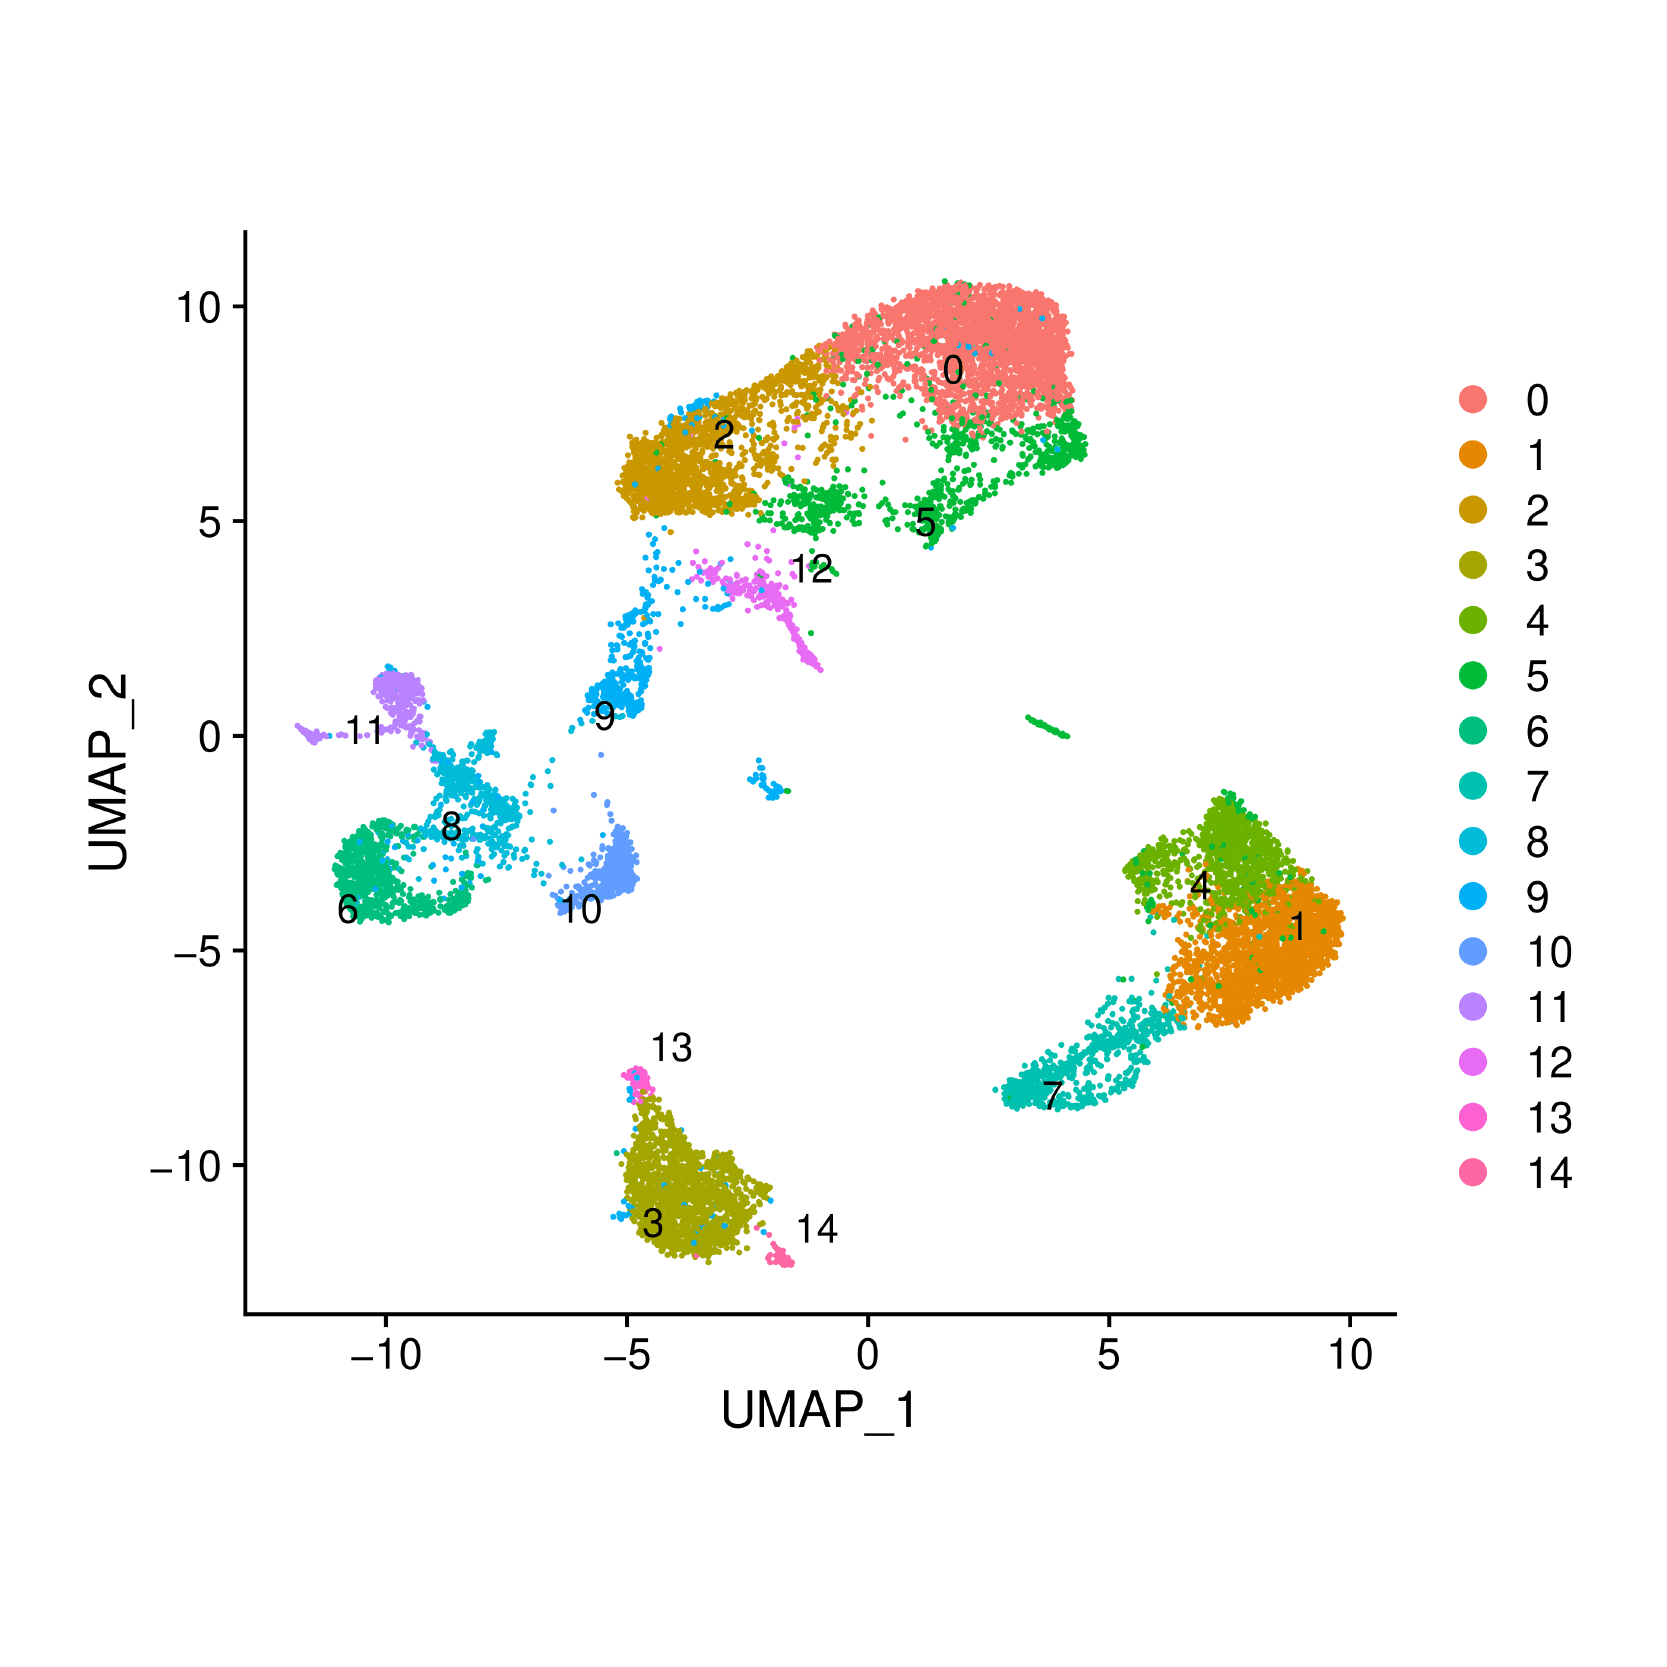
Cell Clusters

T-distributed stochastic neighbor embedding (t-SNE) and uniform manifold approximation and projection (UMAP) visualization of cell clusters. Compared to t-SNE, the UMAP visualization tends to have more compact visual clusters with more empty spaces between them.

Note:Each point represents a cell, and each color designates a cluster.

Image
Image
1/1
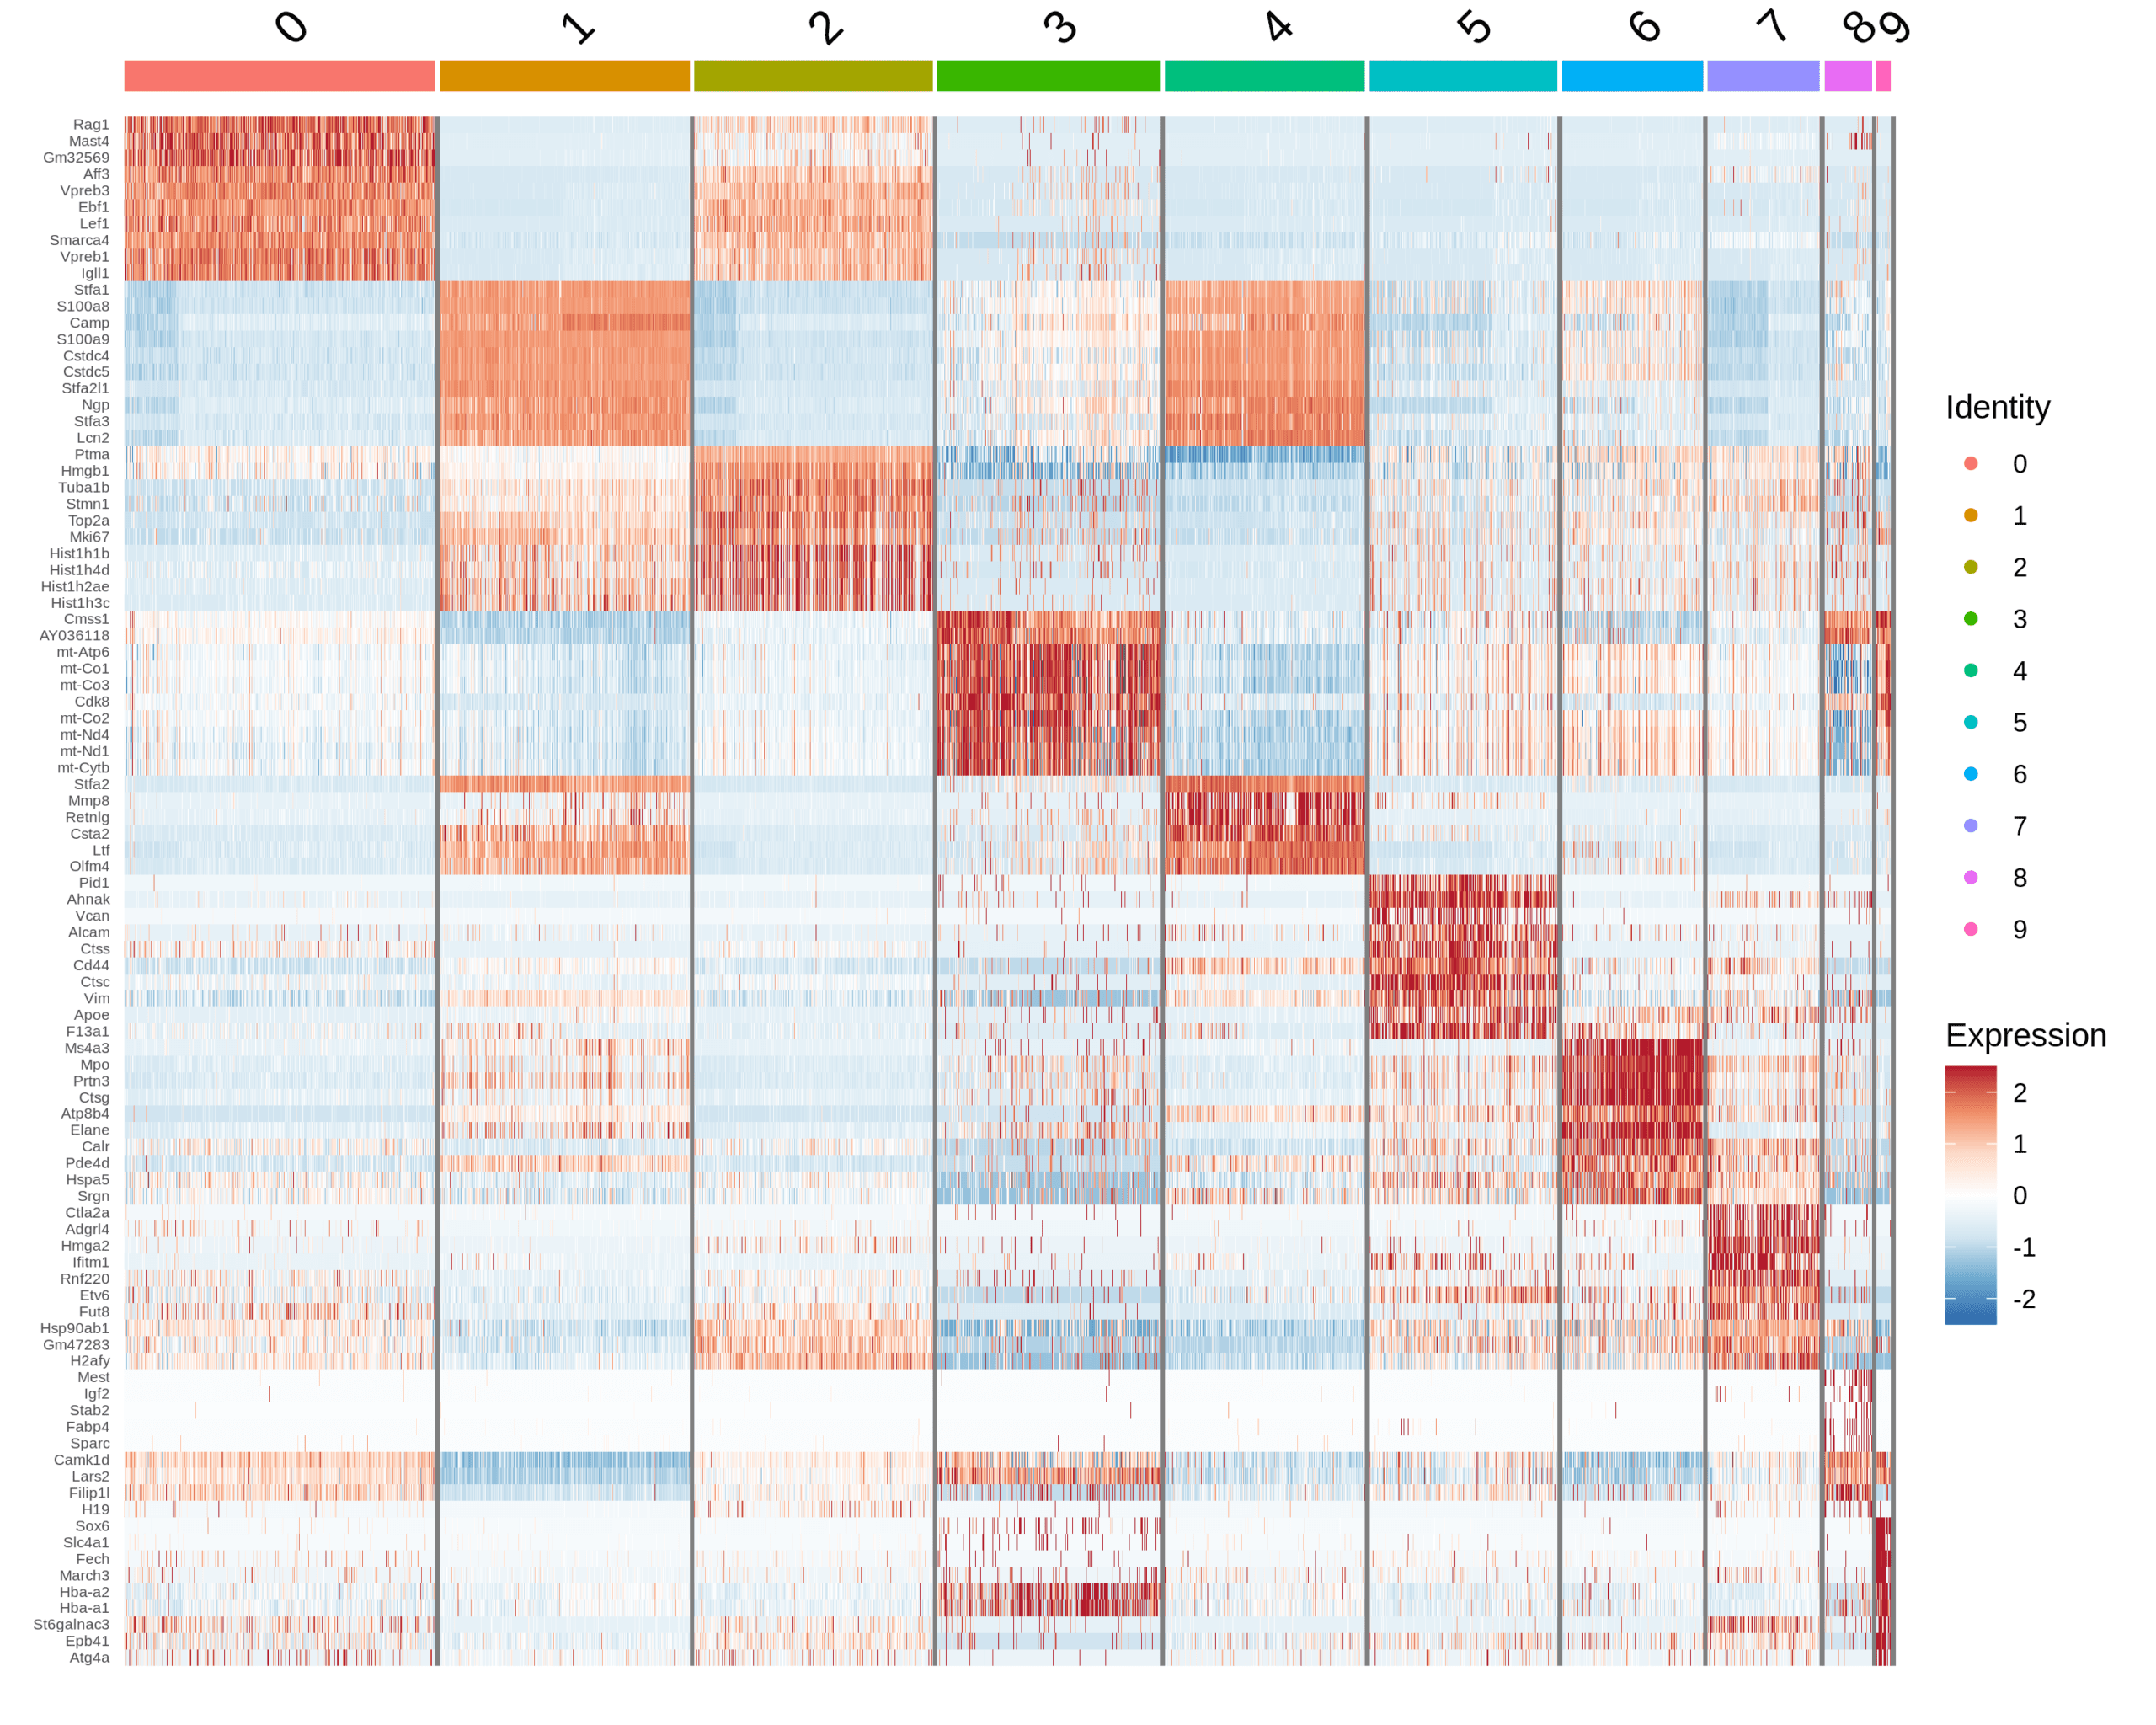
Expression Pattern of Marker Genes

Heatmaps show the expression of indicated marker genes for given cells and features. In this case, we plotted the top 10 markers (or all markers if less than 10) for each cluster.

Note: Darker red represents a higher expression level, and darker blue dictates a lower expression level.

Image
Image
Image
Image
Image
Image
Image
Image
Image
Image
Image
Image
1/6
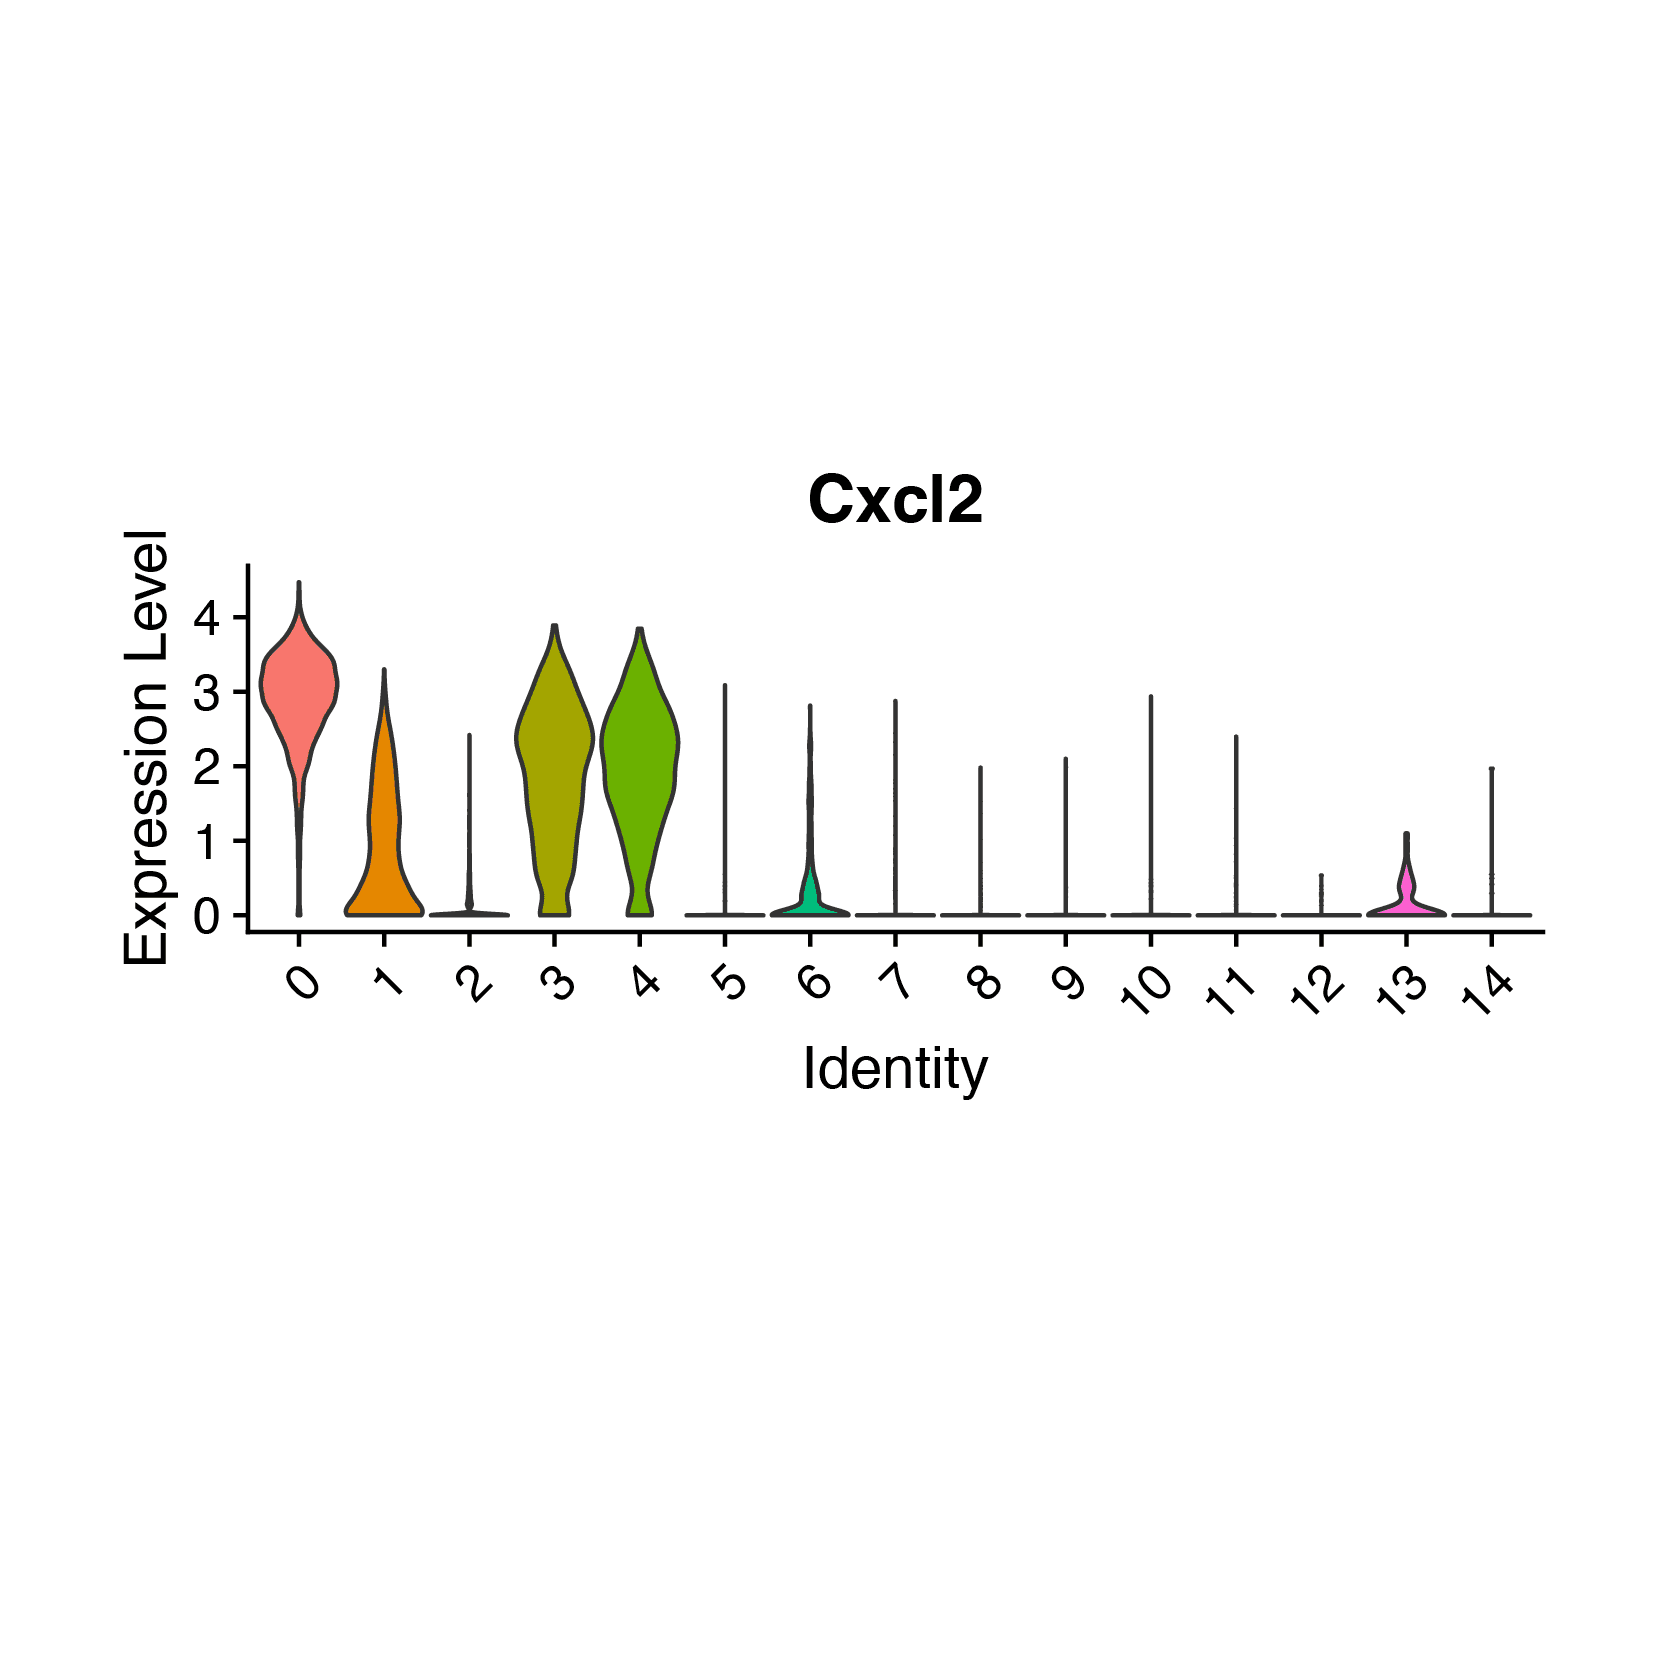
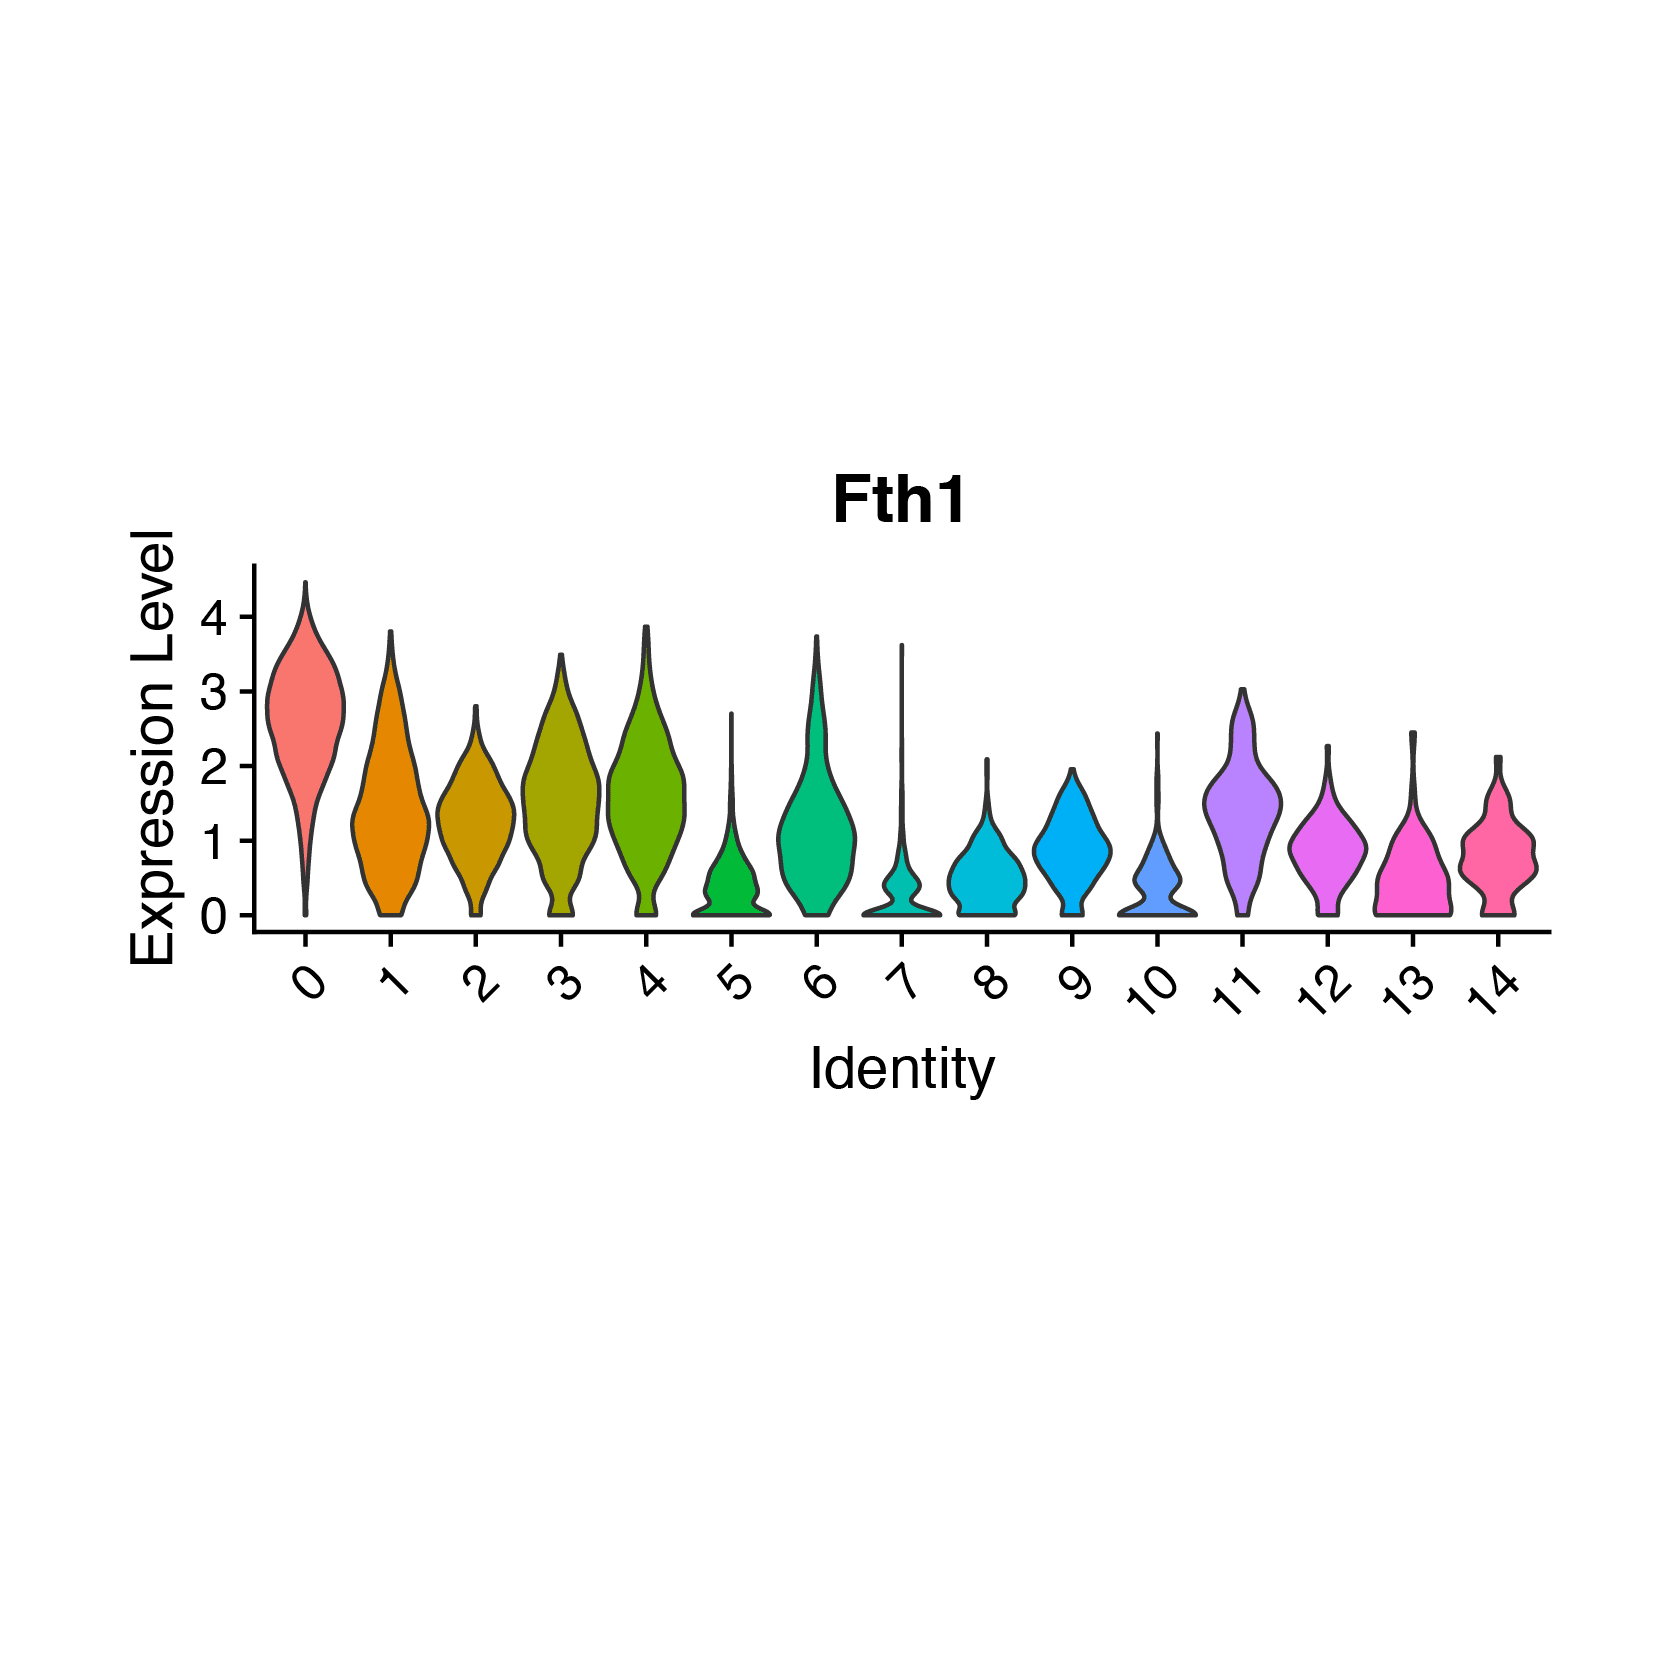
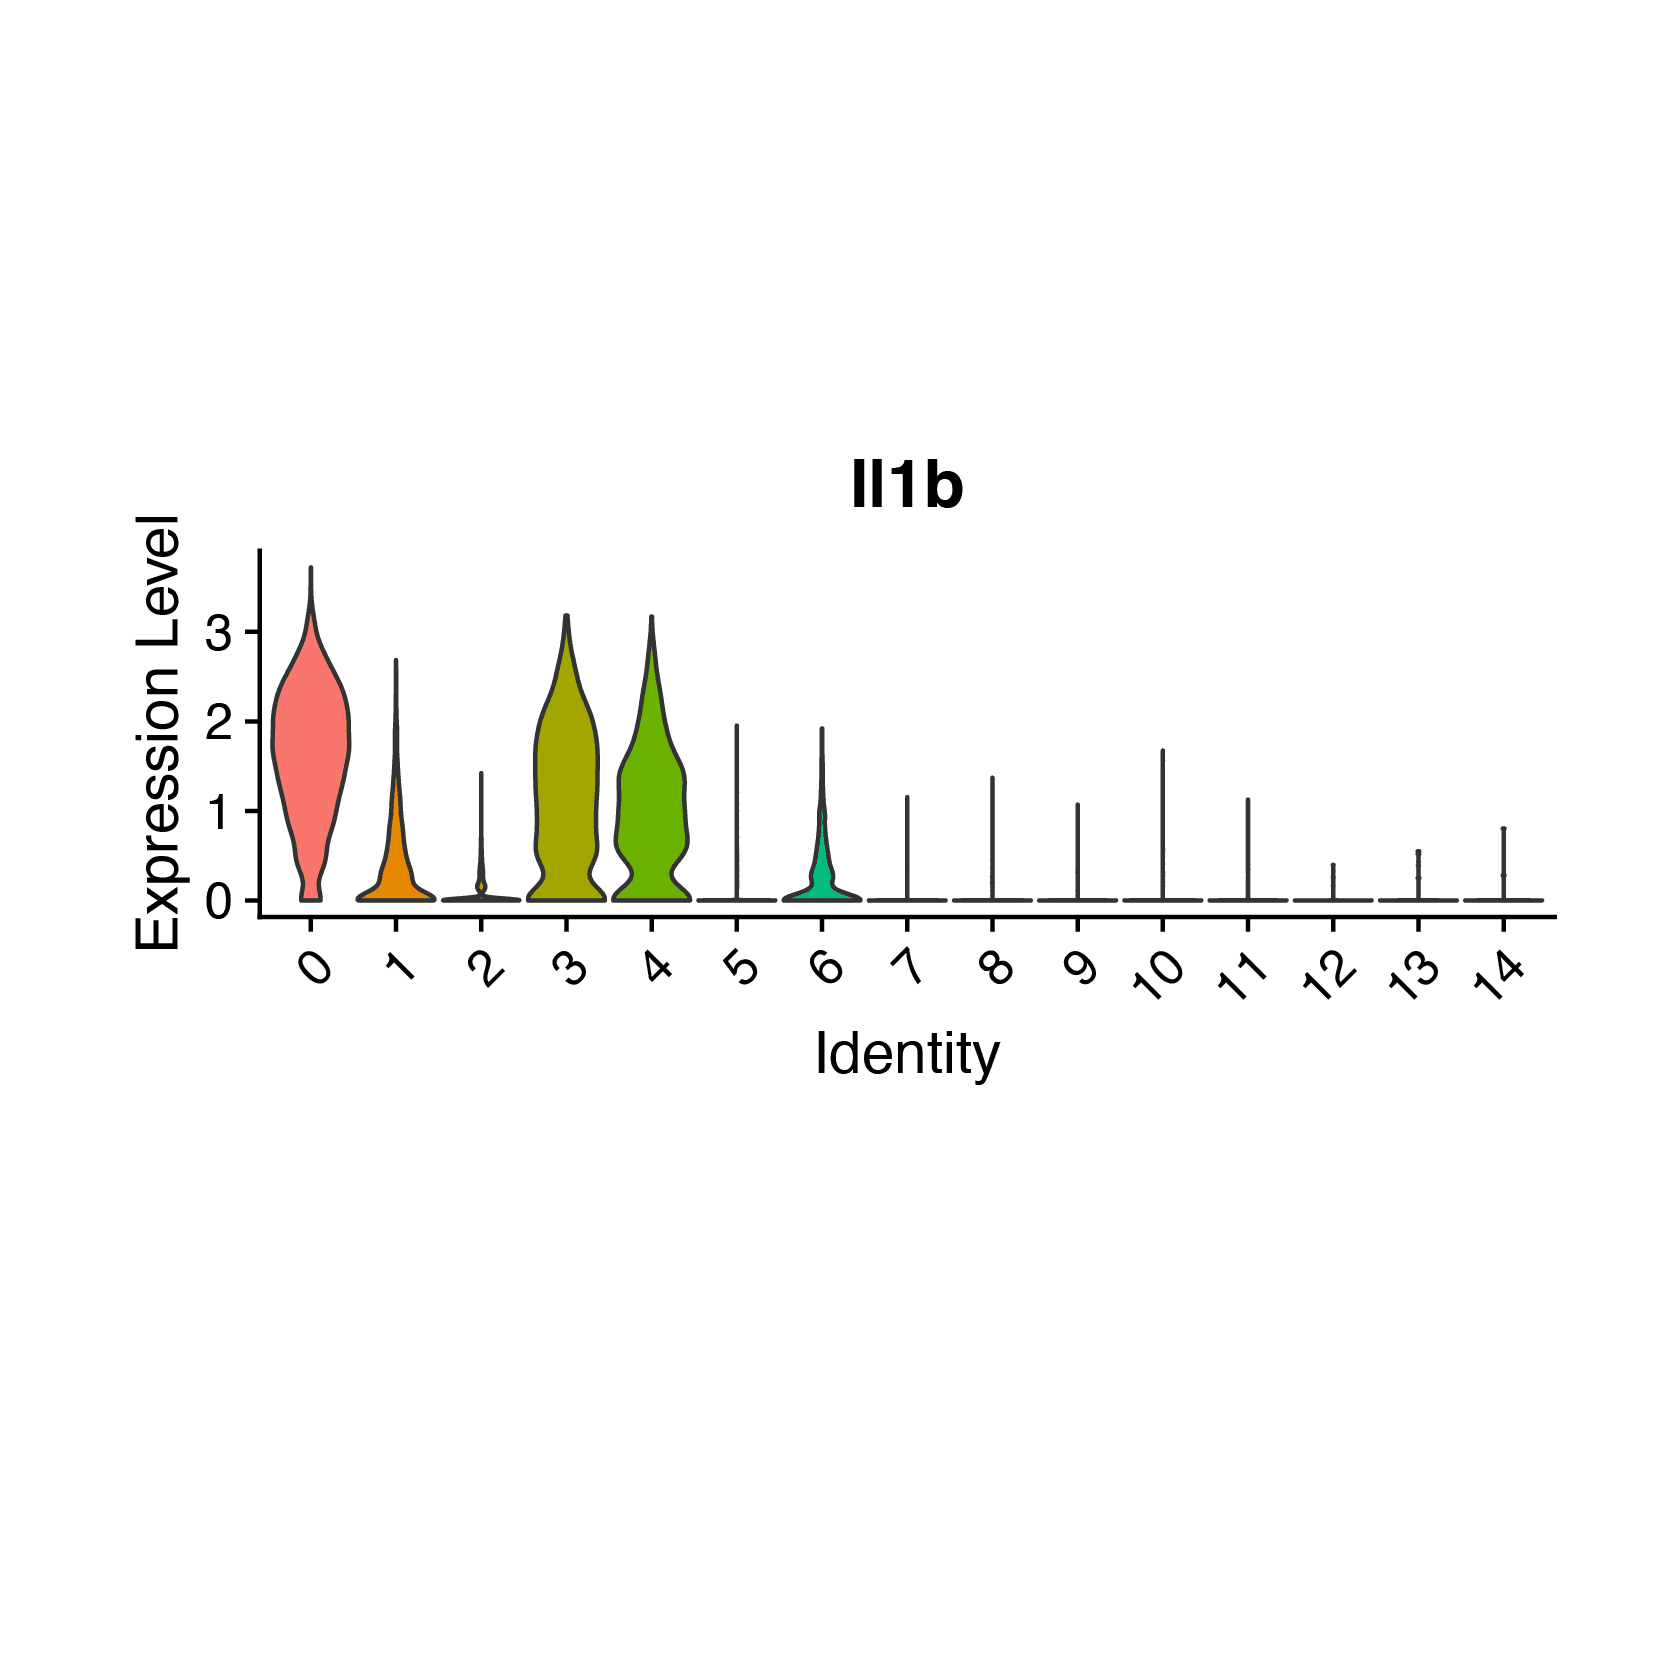
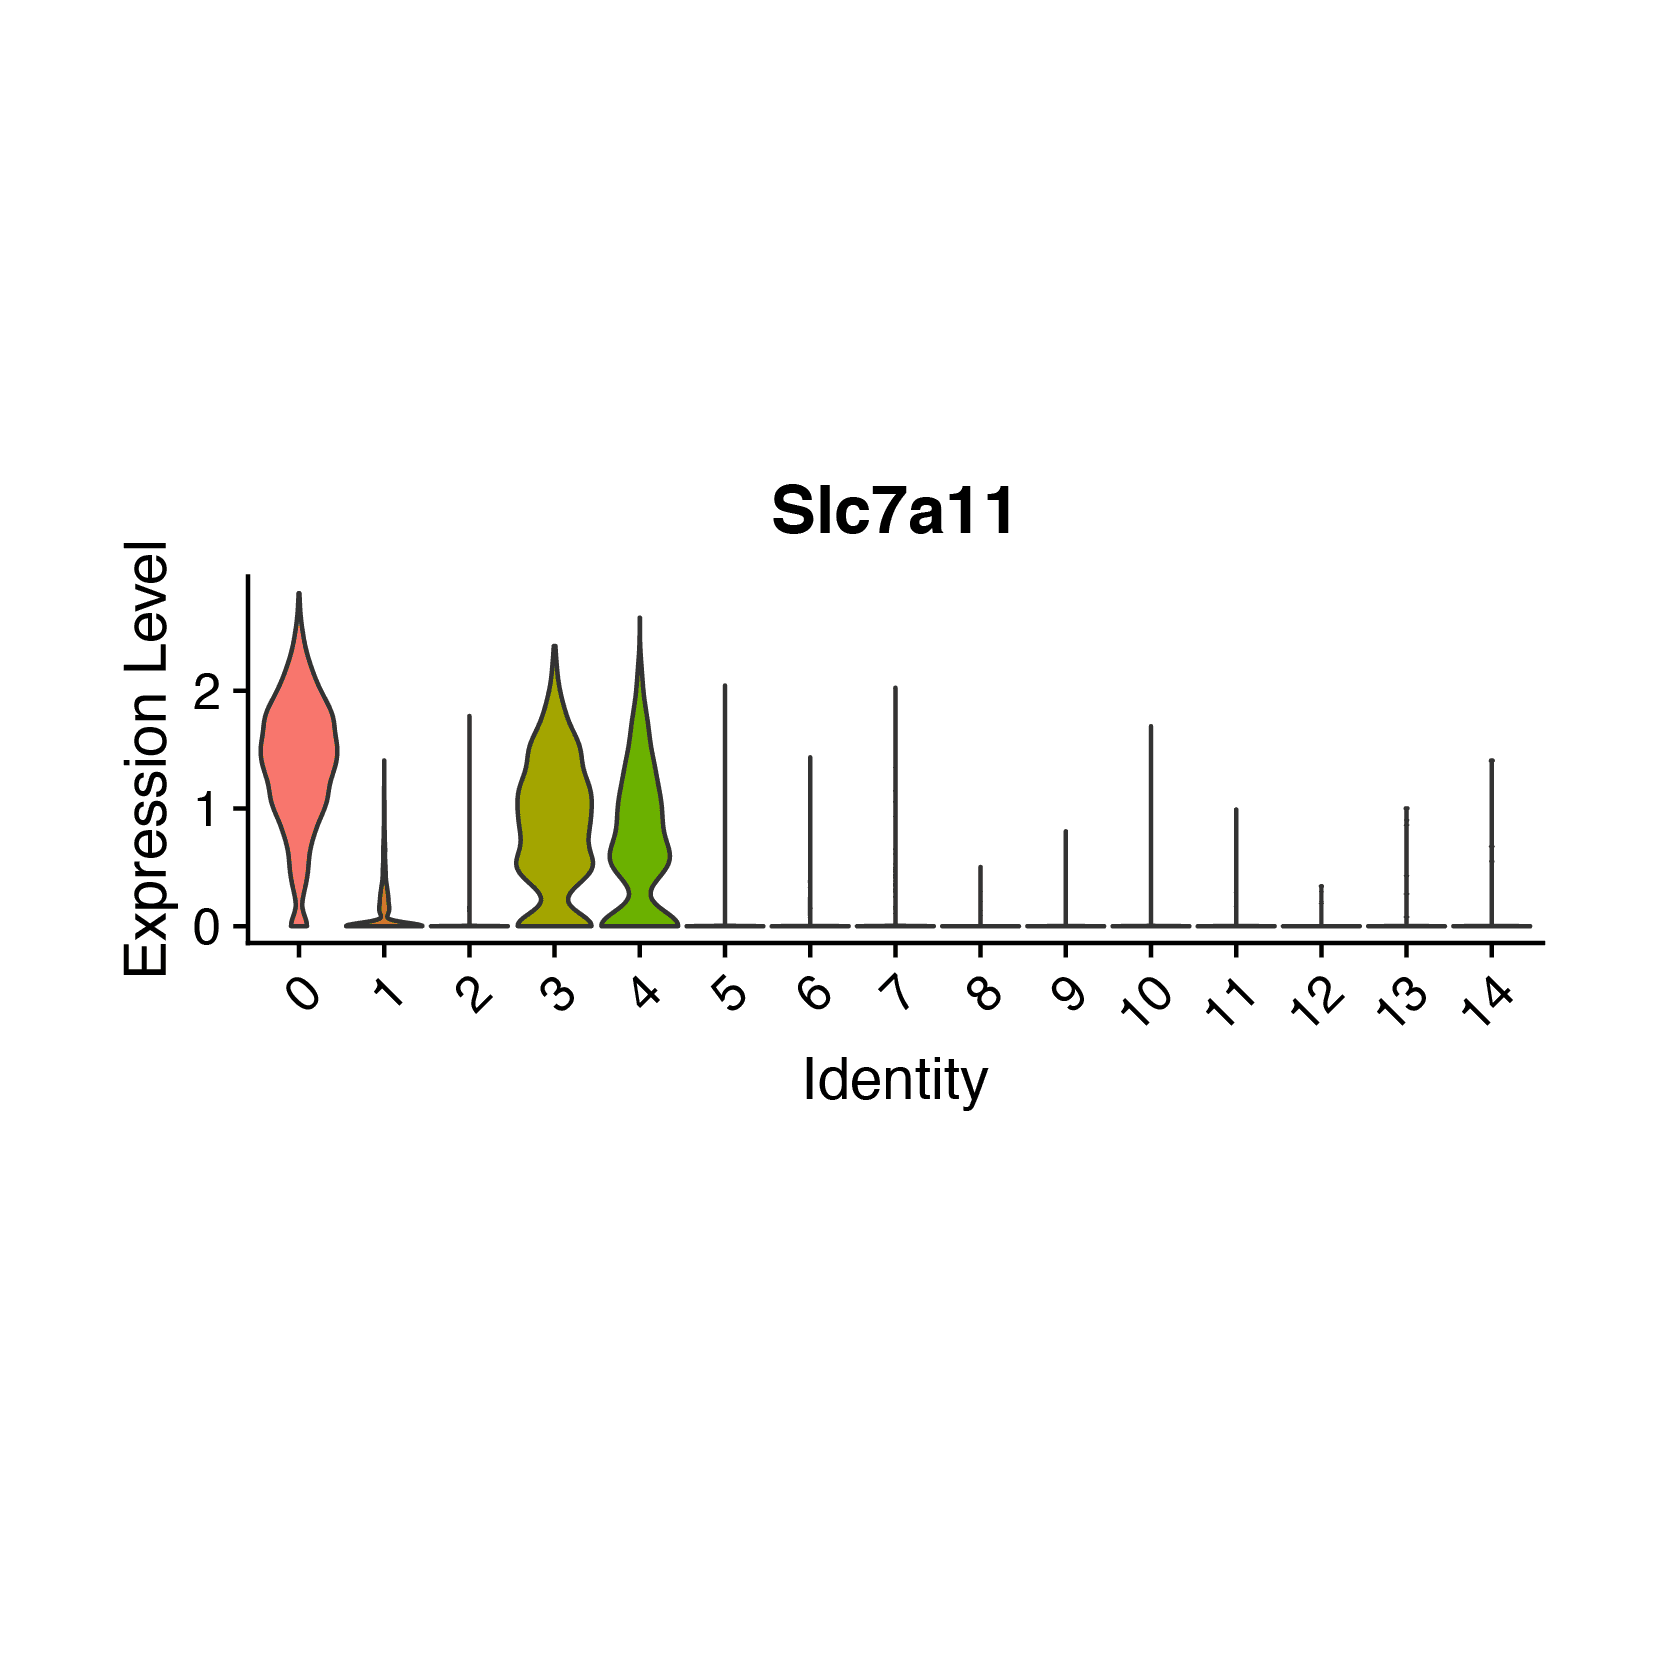
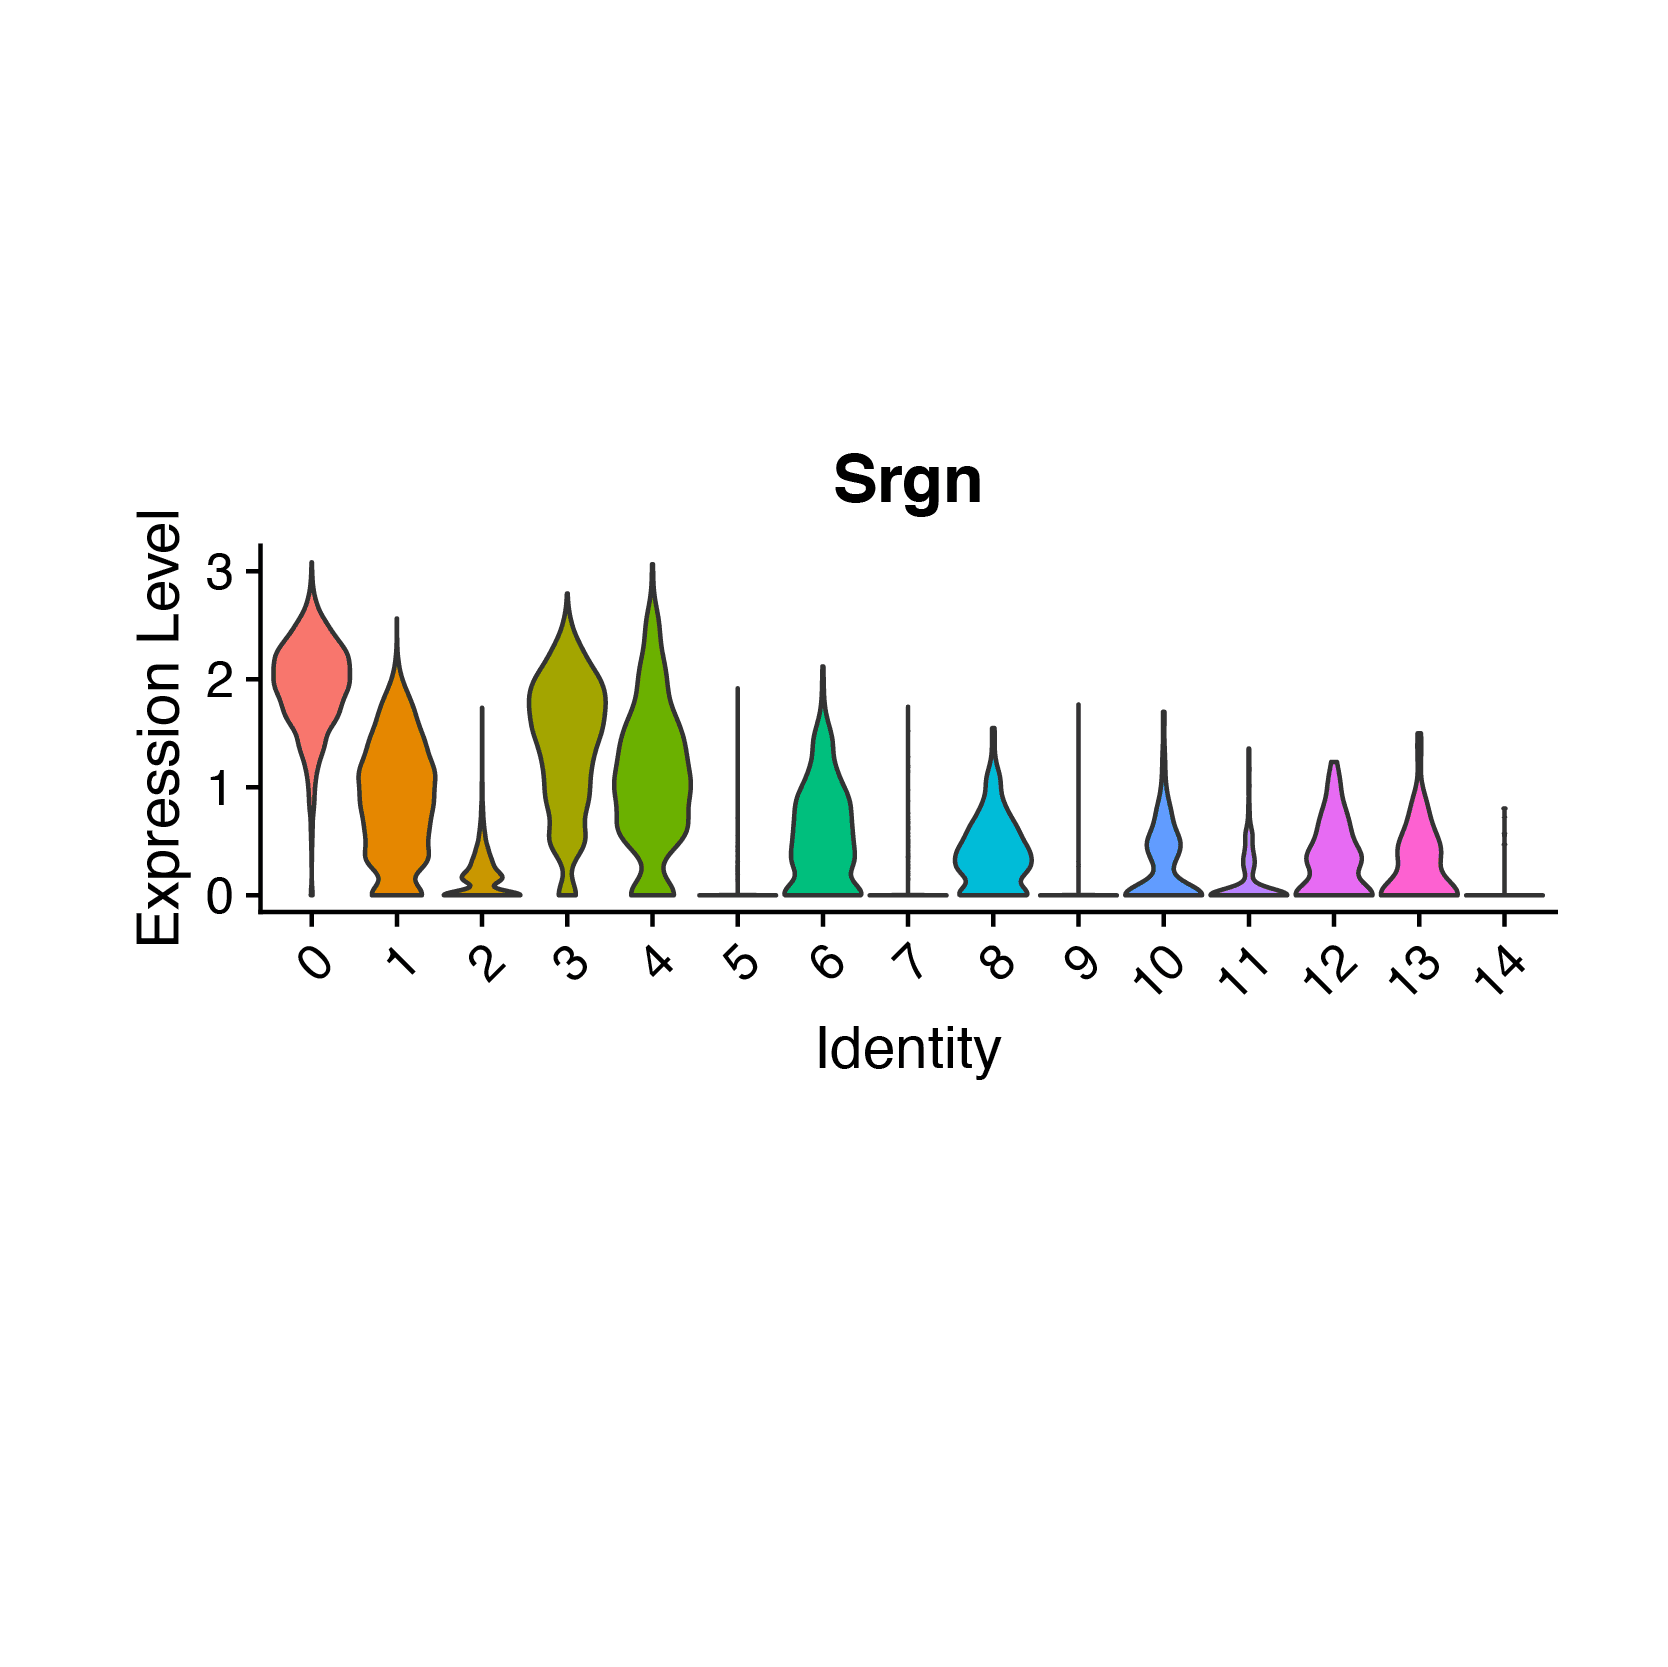
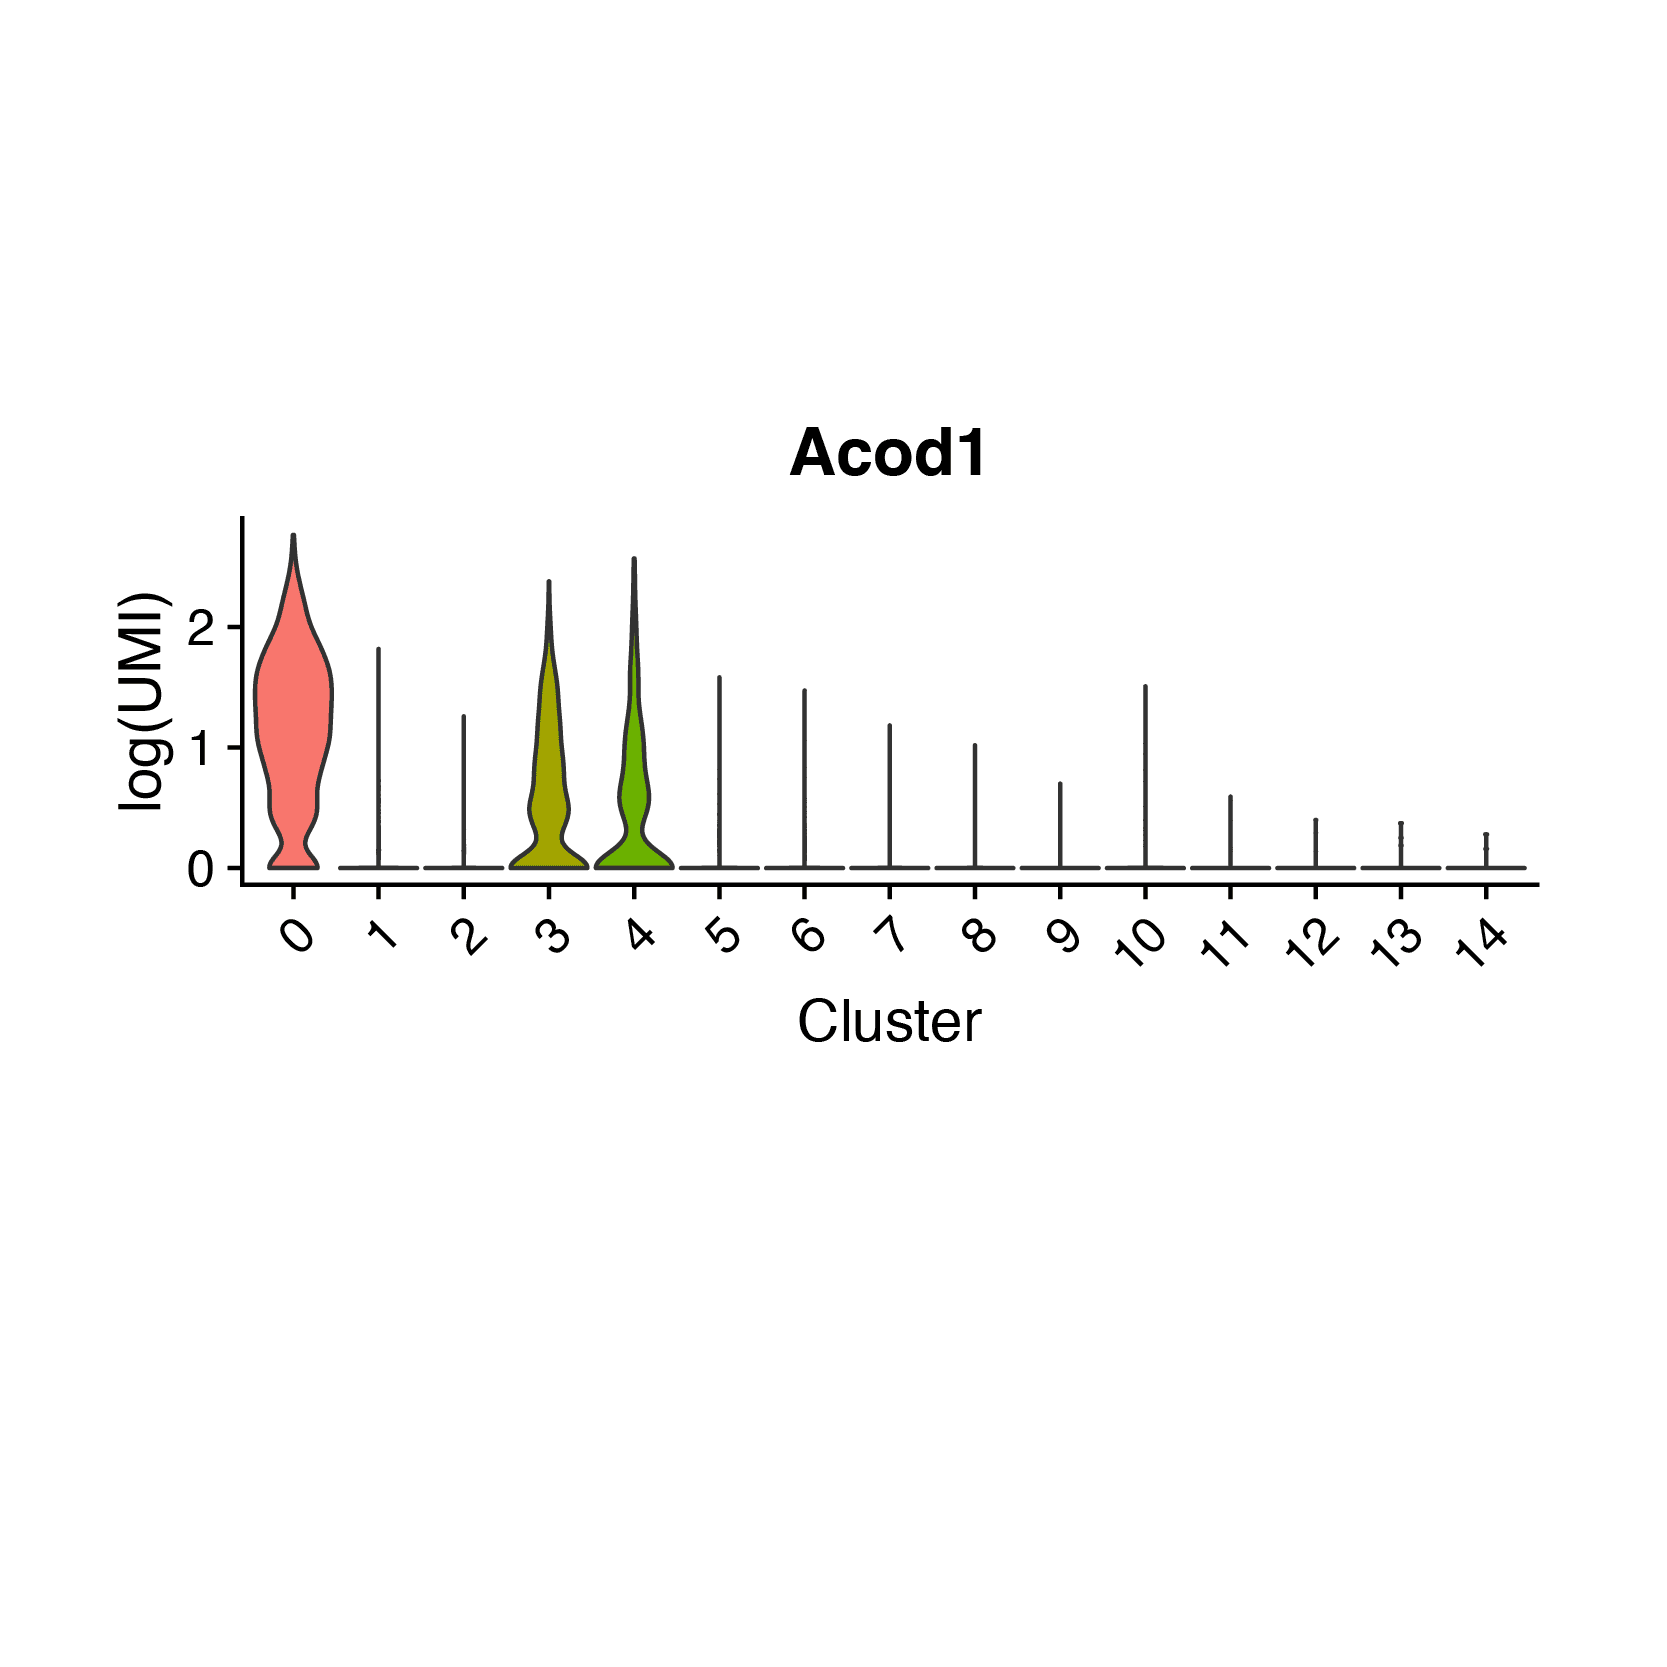
Expression Level of Marker Genes

Violin plots show the relative expression levels of marker genes among all clusters. (Only six marker genes are shown here).

Note: The X-axis represents the cluster, and the Y-axis represents the expression level.

Demo Results

Image
Image
Image
Image
1/2
Cell Clusters

T-distributed stochastic neighbor embedding (t-SNE) and uniform manifold approximation and projection (UMAP) visualization of cell clusters. Compared to t-SNE, the UMAP visualization tends to have more compact visual clusters with more empty spaces between them.

Note:Each point represents a cell, and each color designates a cluster.

Image
Image
1/1
Expression Pattern of Marker Genes

Heatmaps show the expression of indicated marker genes for given cells and features. In this case, we plotted the top 10 markers (or all markers if less than 10) for each cluster.

Note: Darker red represents a higher expression level, and darker blue dictates a lower expression level.

Image
Image
Image
Image
Image
Image
Image
Image
Image
Image
Image
Image
1/6
Expression Level of Marker Genes

Violin plots show the relative expression levels of marker genes among all clusters. (Only six marker genes are shown here).

Note: The X-axis represents the cluster, and the Y-axis represents the expression level.

Image
Image
Image
Image
1/2
Cell Clusters

T-distributed stochastic neighbor embedding (t-SNE) and uniform manifold approximation and projection (UMAP) visualization of cell clusters. Compared to t-SNE, the UMAP visualization tends to have more compact visual clusters with more empty spaces between them.

Note:Each point represents a cell, and each color designates a cluster.

Image
Image
1/1
Expression Pattern of Marker Genes

Heatmaps show the expression of indicated marker genes for given cells and features. In this case, we plotted the top 10 markers (or all markers if less than 10) for each cluster.

Note: Darker red represents a higher expression level, and darker blue dictates a lower expression level.

Image
Image
Image
Image
Image
Image
Image
Image
Image
Image
Image
Image
1/6
Expression Level of Marker Genes

Violin plots show the relative expression levels of marker genes among all clusters. (Only six marker genes are shown here).

Note: The X-axis represents the cluster, and the Y-axis represents the expression level.

More Services

Visium HD Spatial Gene Expression
(Visium HD Spatial Gene Expression)
Visium HD Spatial Gene Expression
(Visium HD Spatial Gene Expression)
Single Cell Immune Profiling Sequencing
(Single Cell Immune Profiling Sequencing)
Single Cell Immune Profiling Sequencing
(Single Cell Immune Profiling Sequencing)
Single Cell Long Read Transcriptome
(Single Cell Long Read Transcriptome)
Single Cell Long Read Transcriptome
(Single Cell Long Read Transcriptome)

More Services

Visium HD Spatial Gene Expression
(Visium HD Spatial Gene Expression)
Visium HD Spatial Gene Expression
(Visium HD Spatial Gene Expression)
Single Cell Immune Profiling Sequencing
(Single Cell Immune Profiling Sequencing)
Single Cell Immune Profiling Sequencing
(Single Cell Immune Profiling Sequencing)
Single Cell Long Read Transcriptome
(Single Cell Long Read Transcriptome)
Single Cell Long Read Transcriptome
(Single Cell Long Read Transcriptome)
Background
Background

Ready to Start Your Project?

Our platform offers tailored solutions for

your unique experimental needs, ensuring a seamless experience from project design to data delivery.


Privacy PolicyCookie PolicyCareers
banner laptop bg
banner mobile bg

Single Cell Gene Expression

High-resolution single-cell transcriptome profiling to reveal cellular heterogeneity and gene expression dynamics across complex populations.
Request a Quote
(Single Cell Gene Expression)
Request a Quote
(Single Cell Gene Expression)
OverviewOverview
BenefitsBenefits
ApplicationsApplications
SpecificationsSpecifications
ResourcesResources

Single-cell RNA sequencing (scRNA-seq) enables the detection of cell-to-cell differences and cellular heterogeneity that are completely obscured by bulk RNA-seq. It provides high-resolution insights into gene expression at the individual cell level. With broad applications across biology and medicine, single-cell sequencing offers unprecedented understanding of cellular behavior, function, and regulation.


Powered by the 10x Genomics® Chromium™ X technology, the Illumina® NovaSeq™ X Plus platform, Novogene provides end-to-end single-cell RNA sequencing (scRNA-seq) solutions — from sample processing and library preparation to sequencing and bioinformatic analysis. Delivered with deep technical expertise and a customer-focused approach, our solutions enable high-resolution exploration of the transcriptome and immune profiling at the single-cell level.

Why Choose Novogene for Single Cell Gene Expression Sequencing?

 End-to-End Service
End-to-End Service

Seamless scRNA-seq workflow from sample processing to bioinformatics with publication-ready outputs

 End-to-End Service
End-to-End Service

Seamless scRNA-seq workflow from sample processing to bioinformatics with publication-ready outputs

Proven Expertise
Proven Expertise

High-quality results with industry-leading turnaround and extensive experience across challenging sample types

Proven Expertise
Proven Expertise

High-quality results with industry-leading turnaround and extensive experience across challenging sample types

Enhanced Sample Processing

Flexible processing including nuclei extraction and specialized frozen tissue workflows for reliable data quality

Enhanced Sample Processing

Flexible processing including nuclei extraction and specialized frozen tissue workflows for reliable data quality

Certified Excellence

10x Genomics CSP using Chromium X with GEM-X for high reproducibility, sensitivity, and efficiency.

Certified Excellence

10x Genomics CSP using Chromium X with GEM-X for high reproducibility, sensitivity, and efficiency.

 Cost-Effective Solutions
Cost-Effective Solutions

State-of-the-art high-throughput platforms and expert support delivering premium data with competitive pricing

 Cost-Effective Solutions
Cost-Effective Solutions

State-of-the-art high-throughput platforms and expert support delivering premium data with competitive pricing

Why Choose Novogene for Single Cell Gene Expression Sequencing?

 End-to-End Service
End-to-End Service

Seamless scRNA-seq workflow from sample processing to bioinformatics with publication-ready outputs

 End-to-End Service
End-to-End Service

Seamless scRNA-seq workflow from sample processing to bioinformatics with publication-ready outputs

Proven Expertise
Proven Expertise

High-quality results with industry-leading turnaround and extensive experience across challenging sample types

Proven Expertise
Proven Expertise

High-quality results with industry-leading turnaround and extensive experience across challenging sample types

Enhanced Sample Processing

Flexible processing including nuclei extraction and specialized frozen tissue workflows for reliable data quality

Enhanced Sample Processing

Flexible processing including nuclei extraction and specialized frozen tissue workflows for reliable data quality

Certified Excellence

10x Genomics CSP using Chromium X with GEM-X for high reproducibility, sensitivity, and efficiency.

Certified Excellence

10x Genomics CSP using Chromium X with GEM-X for high reproducibility, sensitivity, and efficiency.

 Cost-Effective Solutions
Cost-Effective Solutions

State-of-the-art high-throughput platforms and expert support delivering premium data with competitive pricing

 Cost-Effective Solutions
Cost-Effective Solutions

State-of-the-art high-throughput platforms and expert support delivering premium data with competitive pricing

Applications of Single Cell Gene Expression Sequencing in Research and Medicine

scRNA-seq is a powerful tool supporting a wide range of research areas, including:

Cancer Research

Uncovering cellular heterogeneity within the tumor microenvironment to reveal cancer mechanisms and potential therapeutic targets.

Cancer Research

Uncovering cellular heterogeneity within the tumor microenvironment to reveal cancer mechanisms and potential therapeutic targets.

Immunology

Mapping immune cell diversity and revealing the molecular mechanisms behind immune regulation and dysfunction.

Immunology

Mapping immune cell diversity and revealing the molecular mechanisms behind immune regulation and dysfunction.

Neuroscience

Deciphering development and regulatory networks to identify potential therapeutic targets for neurological diseases.

Neuroscience

Deciphering development and regulatory networks to identify potential therapeutic targets for neurological diseases.

Developmental Biology

Charting cell lineage and developmental trajectories to elucidate organ formation and tissue differentiation.

Developmental Biology

Charting cell lineage and developmental trajectories to elucidate organ formation and tissue differentiation.

Applications of Single Cell Gene Expression Sequencing in Research and Medicine

scRNA-seq is a powerful tool supporting a wide range of research areas, including:

Cancer Research

Uncovering cellular heterogeneity within the tumor microenvironment to reveal cancer mechanisms and potential therapeutic targets.

Cancer Research

Uncovering cellular heterogeneity within the tumor microenvironment to reveal cancer mechanisms and potential therapeutic targets.

Immunology

Mapping immune cell diversity and revealing the molecular mechanisms behind immune regulation and dysfunction.

Immunology

Mapping immune cell diversity and revealing the molecular mechanisms behind immune regulation and dysfunction.

Neuroscience

Deciphering development and regulatory networks to identify potential therapeutic targets for neurological diseases.

Neuroscience

Deciphering development and regulatory networks to identify potential therapeutic targets for neurological diseases.

Developmental Biology

Charting cell lineage and developmental trajectories to elucidate organ formation and tissue differentiation.

Developmental Biology

Charting cell lineage and developmental trajectories to elucidate organ formation and tissue differentiation.

Specifications

Sample Requirements

Sample amounts are listed for reference only. Download the Sample Requirements to learn more. For detailed information, please contact us with your customized requests.

ServiceSample Type*Sample AmountTransportation Method
scRNA-seqCryopreserved cell suspensionRecommended Amount ≥1,000,000 cells per sample;
(minimum ≥ 500,000 cells)
Needs to be shipped with dry ice
Fresh cell suspensionRecommended Amount:300,000 cells per sample;
(minimum ≥ 100,000 cells)
Needs to be shipped with ice packs within 1hr or harvest
Frozen tissue
Tissue weight ≥ 200mg
(minimum ≥ 100mg)
≥ 2 tissue pieces/sample, separate 1.5ml cryovials
Needs to be shipped with dry ice
Fresh tissueTissue weight ≥ 200mg
(minimum ≥ 100mg)
≥ 2 tissue pieces/sample, separate 1.5ml cryovials
Needs to be shipped with ice packs within 48hrs of harvest
*Sample type preferences may vary based on sequencing requirements and sample compatibility.

Sample Requirements

Sample amounts are listed for reference only. Download the Sample Requirements to learn more. For detailed information, please contact us with your customized requests.

ServiceSample Type*Sample AmountTransportation Method
scRNA-seqCryopreserved cell suspensionRecommended Amount ≥1,000,000 cells per sample;
(minimum ≥ 500,000 cells)
Needs to be shipped with dry ice
Fresh cell suspensionRecommended Amount:300,000 cells per sample;
(minimum ≥ 100,000 cells)
Needs to be shipped with ice packs within 1hr or harvest
Frozen tissue
Tissue weight ≥ 200mg
(minimum ≥ 100mg)
≥ 2 tissue pieces/sample, separate 1.5ml cryovials
Needs to be shipped with dry ice
Fresh tissueTissue weight ≥ 200mg
(minimum ≥ 100mg)
≥ 2 tissue pieces/sample, separate 1.5ml cryovials
Needs to be shipped with ice packs within 48hrs of harvest
*Sample type preferences may vary based on sequencing requirements and sample compatibility.

Sample Requirements

Sample amounts are listed for reference only. Download the Sample Requirements to learn more. For detailed information, please contact us with your customized requests.

ServiceSample Type*Sample AmountTransportation Method
scRNA-seqCryopreserved cell suspensionRecommended Amount ≥1,000,000 cells per sample;
(minimum ≥ 500,000 cells)
Needs to be shipped with dry ice
Fresh cell suspensionRecommended Amount:300,000 cells per sample;
(minimum ≥ 100,000 cells)
Needs to be shipped with ice packs within 1hr or harvest
Frozen tissue
Tissue weight ≥ 200mg
(minimum ≥ 100mg)
≥ 2 tissue pieces/sample, separate 1.5ml cryovials
Needs to be shipped with dry ice
Fresh tissueTissue weight ≥ 200mg
(minimum ≥ 100mg)
≥ 2 tissue pieces/sample, separate 1.5ml cryovials
Needs to be shipped with ice packs within 48hrs of harvest
*Sample type preferences may vary based on sequencing requirements and sample compatibility.

Sample Requirements

Sample amounts are listed for reference only. Download the Sample Requirements to learn more. For detailed information, please contact us with your customized requests.

ServiceSample Type*Sample AmountTransportation Method
scRNA-seqCryopreserved cell suspensionRecommended Amount ≥1,000,000 cells per sample;
(minimum ≥ 500,000 cells)
Needs to be shipped with dry ice
Fresh cell suspensionRecommended Amount:300,000 cells per sample;
(minimum ≥ 100,000 cells)
Needs to be shipped with ice packs within 1hr or harvest
Frozen tissue
Tissue weight ≥ 200mg
(minimum ≥ 100mg)
≥ 2 tissue pieces/sample, separate 1.5ml cryovials
Needs to be shipped with dry ice
Fresh tissueTissue weight ≥ 200mg
(minimum ≥ 100mg)
≥ 2 tissue pieces/sample, separate 1.5ml cryovials
Needs to be shipped with ice packs within 48hrs of harvest
*Sample type preferences may vary based on sequencing requirements and sample compatibility.

Sequencing and Analysis

Recommended data outputs and analysis contents displayed are for reference only. For detailed information, please contact us with your customized requests.

Sequencing PlatformIllumina NovaSeq X-Plus Sequencing Platform
Read LengthPaired-end 150 bp
Recommended Data20,000 – 50,000 read pairs/cell, 100-120Gb/sample
AnalysisCell Ranger Analysis
Demultiplex BCL files from a sequencer into FASTQs.
Summary metrics (sequencing quality, number of cells detected, the mean reads per cell, and the median genes detected per cell et al.).
Alignment of reads to genome.
Gene expression quantification.
Clustering analysis.
Differentially expression analysis between clusters.
Visualization.
Standard Analysis
Demultiplex BCL files from a sequencer into FASTQs. Alignment, UMI counting, Metrics summary.
Identification of highly variable gene (HVGs).
Cell Subpopulation Identification.
Principal component analysis (PCA).
Identify clusters of cells.
Dimensionality reduction and Visualization.
Marker gene detection (Differentially expression analysis between clusters).
GO/KEGG/Reactome Enrichment.
FunctionalAnnotation of Transcription Factor.
Protein-Protein Interaction Network Analysis.

Project Workflow

We support an end-to-end suite of services to ensure that our clients gets the best quality data. This includes a pre-project consultation with our application experts in experimental design, subsequent sample preparation, library construction, sequencing, and bioinformatics analysis.

Project Workflow

Sequencing and Analysis

Recommended data outputs and analysis contents displayed are for reference only. For detailed information, please contact us with your customized requests.

Sequencing PlatformIllumina NovaSeq X-Plus Sequencing Platform
Read LengthPaired-end 150 bp
Recommended Data20,000 – 50,000 read pairs/cell, 100-120Gb/sample
AnalysisCell Ranger Analysis
Demultiplex BCL files from a sequencer into FASTQs.
Summary metrics (sequencing quality, number of cells detected, the mean reads per cell, and the median genes detected per cell et al.).
Alignment of reads to genome.
Gene expression quantification.
Clustering analysis.
Differentially expression analysis between clusters.
Visualization.
Standard Analysis
Demultiplex BCL files from a sequencer into FASTQs. Alignment, UMI counting, Metrics summary.
Identification of highly variable gene (HVGs).
Cell Subpopulation Identification.
Principal component analysis (PCA).
Identify clusters of cells.
Dimensionality reduction and Visualization.
Marker gene detection (Differentially expression analysis between clusters).
GO/KEGG/Reactome Enrichment.
FunctionalAnnotation of Transcription Factor.
Protein-Protein Interaction Network Analysis.

Project Workflow

We support an end-to-end suite of services to ensure that our clients gets the best quality data. This includes a pre-project consultation with our application experts in experimental design, subsequent sample preparation, library construction, sequencing, and bioinformatics analysis.

Project Workflow

Sequencing and Analysis

Recommended data outputs and analysis contents displayed are for reference only. For detailed information, please contact us with your customized requests.

Sequencing PlatformIllumina NovaSeq X-Plus Sequencing Platform
Read LengthPaired-end 150 bp
Recommended Data20,000 – 50,000 read pairs/cell, 100-120Gb/sample
AnalysisCell Ranger Analysis
Demultiplex BCL files from a sequencer into FASTQs.
Summary metrics (sequencing quality, number of cells detected, the mean reads per cell, and the median genes detected per cell et al.).
Alignment of reads to genome.
Gene expression quantification.
Clustering analysis.
Differentially expression analysis between clusters.
Visualization.
Standard Analysis
Demultiplex BCL files from a sequencer into FASTQs. Alignment, UMI counting, Metrics summary.
Identification of highly variable gene (HVGs).
Cell Subpopulation Identification.
Principal component analysis (PCA).
Identify clusters of cells.
Dimensionality reduction and Visualization.
Marker gene detection (Differentially expression analysis between clusters).
GO/KEGG/Reactome Enrichment.
FunctionalAnnotation of Transcription Factor.
Protein-Protein Interaction Network Analysis.

Project Workflow

We support an end-to-end suite of services to ensure that our clients gets the best quality data. This includes a pre-project consultation with our application experts in experimental design, subsequent sample preparation, library construction, sequencing, and bioinformatics analysis.

Project Workflow

Sequencing and Analysis

Recommended data outputs and analysis contents displayed are for reference only. For detailed information, please contact us with your customized requests.

Sequencing PlatformIllumina NovaSeq X-Plus Sequencing Platform
Read LengthPaired-end 150 bp
Recommended Data20,000 – 50,000 read pairs/cell, 100-120Gb/sample
AnalysisCell Ranger Analysis
Demultiplex BCL files from a sequencer into FASTQs.
Summary metrics (sequencing quality, number of cells detected, the mean reads per cell, and the median genes detected per cell et al.).
Alignment of reads to genome.
Gene expression quantification.
Clustering analysis.
Differentially expression analysis between clusters.
Visualization.
Standard Analysis
Demultiplex BCL files from a sequencer into FASTQs. Alignment, UMI counting, Metrics summary.
Identification of highly variable gene (HVGs).
Cell Subpopulation Identification.
Principal component analysis (PCA).
Identify clusters of cells.
Dimensionality reduction and Visualization.
Marker gene detection (Differentially expression analysis between clusters).
GO/KEGG/Reactome Enrichment.
FunctionalAnnotation of Transcription Factor.
Protein-Protein Interaction Network Analysis.

Project Workflow

We support an end-to-end suite of services to ensure that our clients gets the best quality data. This includes a pre-project consultation with our application experts in experimental design, subsequent sample preparation, library construction, sequencing, and bioinformatics analysis.

Project Workflow

Specifications

Sample Requirements

Sample amounts are listed for reference only. Download the Sample Requirements to learn more. For detailed information, please contact us with your customized requests.

ServiceSample Type*Sample AmountTransportation Method
scRNA-seqCryopreserved cell suspensionRecommended Amount ≥1,000,000 cells per sample;
(minimum ≥ 500,000 cells)
Needs to be shipped with dry ice
Fresh cell suspensionRecommended Amount:300,000 cells per sample;
(minimum ≥ 100,000 cells)
Needs to be shipped with ice packs within 1hr or harvest
Frozen tissue
Tissue weight ≥ 200mg
(minimum ≥ 100mg)
≥ 2 tissue pieces/sample, separate 1.5ml cryovials
Needs to be shipped with dry ice
Fresh tissueTissue weight ≥ 200mg
(minimum ≥ 100mg)
≥ 2 tissue pieces/sample, separate 1.5ml cryovials
Needs to be shipped with ice packs within 48hrs of harvest
*Sample type preferences may vary based on sequencing requirements and sample compatibility.

Sample Requirements

Sample amounts are listed for reference only. Download the Sample Requirements to learn more. For detailed information, please contact us with your customized requests.

ServiceSample Type*Sample AmountTransportation Method
scRNA-seqCryopreserved cell suspensionRecommended Amount ≥1,000,000 cells per sample;
(minimum ≥ 500,000 cells)
Needs to be shipped with dry ice
Fresh cell suspensionRecommended Amount:300,000 cells per sample;
(minimum ≥ 100,000 cells)
Needs to be shipped with ice packs within 1hr or harvest
Frozen tissue
Tissue weight ≥ 200mg
(minimum ≥ 100mg)
≥ 2 tissue pieces/sample, separate 1.5ml cryovials
Needs to be shipped with dry ice
Fresh tissueTissue weight ≥ 200mg
(minimum ≥ 100mg)
≥ 2 tissue pieces/sample, separate 1.5ml cryovials
Needs to be shipped with ice packs within 48hrs of harvest
*Sample type preferences may vary based on sequencing requirements and sample compatibility.

Sample Requirements

Sample amounts are listed for reference only. Download the Sample Requirements to learn more. For detailed information, please contact us with your customized requests.

ServiceSample Type*Sample AmountTransportation Method
scRNA-seqCryopreserved cell suspensionRecommended Amount ≥1,000,000 cells per sample;
(minimum ≥ 500,000 cells)
Needs to be shipped with dry ice
Fresh cell suspensionRecommended Amount:300,000 cells per sample;
(minimum ≥ 100,000 cells)
Needs to be shipped with ice packs within 1hr or harvest
Frozen tissue
Tissue weight ≥ 200mg
(minimum ≥ 100mg)
≥ 2 tissue pieces/sample, separate 1.5ml cryovials
Needs to be shipped with dry ice
Fresh tissueTissue weight ≥ 200mg
(minimum ≥ 100mg)
≥ 2 tissue pieces/sample, separate 1.5ml cryovials
Needs to be shipped with ice packs within 48hrs of harvest
*Sample type preferences may vary based on sequencing requirements and sample compatibility.

Sample Requirements

Sample amounts are listed for reference only. Download the Sample Requirements to learn more. For detailed information, please contact us with your customized requests.

ServiceSample Type*Sample AmountTransportation Method
scRNA-seqCryopreserved cell suspensionRecommended Amount ≥1,000,000 cells per sample;
(minimum ≥ 500,000 cells)
Needs to be shipped with dry ice
Fresh cell suspensionRecommended Amount:300,000 cells per sample;
(minimum ≥ 100,000 cells)
Needs to be shipped with ice packs within 1hr or harvest
Frozen tissue
Tissue weight ≥ 200mg
(minimum ≥ 100mg)
≥ 2 tissue pieces/sample, separate 1.5ml cryovials
Needs to be shipped with dry ice
Fresh tissueTissue weight ≥ 200mg
(minimum ≥ 100mg)
≥ 2 tissue pieces/sample, separate 1.5ml cryovials
Needs to be shipped with ice packs within 48hrs of harvest
*Sample type preferences may vary based on sequencing requirements and sample compatibility.

Sequencing and Analysis

Recommended data outputs and analysis contents displayed are for reference only. For detailed information, please contact us with your customized requests.

Sequencing PlatformIllumina NovaSeq X-Plus Sequencing Platform
Read LengthPaired-end 150 bp
Recommended Data20,000 – 50,000 read pairs/cell, 100-120Gb/sample
AnalysisCell Ranger Analysis
Demultiplex BCL files from a sequencer into FASTQs.
Summary metrics (sequencing quality, number of cells detected, the mean reads per cell, and the median genes detected per cell et al.).
Alignment of reads to genome.
Gene expression quantification.
Clustering analysis.
Differentially expression analysis between clusters.
Visualization.
Standard Analysis
Demultiplex BCL files from a sequencer into FASTQs. Alignment, UMI counting, Metrics summary.
Identification of highly variable gene (HVGs).
Cell Subpopulation Identification.
Principal component analysis (PCA).
Identify clusters of cells.
Dimensionality reduction and Visualization.
Marker gene detection (Differentially expression analysis between clusters).
GO/KEGG/Reactome Enrichment.
FunctionalAnnotation of Transcription Factor.
Protein-Protein Interaction Network Analysis.

Project Workflow

We support an end-to-end suite of services to ensure that our clients gets the best quality data. This includes a pre-project consultation with our application experts in experimental design, subsequent sample preparation, library construction, sequencing, and bioinformatics analysis.

Project Workflow

Sequencing and Analysis

Recommended data outputs and analysis contents displayed are for reference only. For detailed information, please contact us with your customized requests.

Sequencing PlatformIllumina NovaSeq X-Plus Sequencing Platform
Read LengthPaired-end 150 bp
Recommended Data20,000 – 50,000 read pairs/cell, 100-120Gb/sample
AnalysisCell Ranger Analysis
Demultiplex BCL files from a sequencer into FASTQs.
Summary metrics (sequencing quality, number of cells detected, the mean reads per cell, and the median genes detected per cell et al.).
Alignment of reads to genome.
Gene expression quantification.
Clustering analysis.
Differentially expression analysis between clusters.
Visualization.
Standard Analysis
Demultiplex BCL files from a sequencer into FASTQs. Alignment, UMI counting, Metrics summary.
Identification of highly variable gene (HVGs).
Cell Subpopulation Identification.
Principal component analysis (PCA).
Identify clusters of cells.
Dimensionality reduction and Visualization.
Marker gene detection (Differentially expression analysis between clusters).
GO/KEGG/Reactome Enrichment.
FunctionalAnnotation of Transcription Factor.
Protein-Protein Interaction Network Analysis.

Project Workflow

We support an end-to-end suite of services to ensure that our clients gets the best quality data. This includes a pre-project consultation with our application experts in experimental design, subsequent sample preparation, library construction, sequencing, and bioinformatics analysis.

Project Workflow

Sequencing and Analysis

Recommended data outputs and analysis contents displayed are for reference only. For detailed information, please contact us with your customized requests.

Sequencing PlatformIllumina NovaSeq X-Plus Sequencing Platform
Read LengthPaired-end 150 bp
Recommended Data20,000 – 50,000 read pairs/cell, 100-120Gb/sample
AnalysisCell Ranger Analysis
Demultiplex BCL files from a sequencer into FASTQs.
Summary metrics (sequencing quality, number of cells detected, the mean reads per cell, and the median genes detected per cell et al.).
Alignment of reads to genome.
Gene expression quantification.
Clustering analysis.
Differentially expression analysis between clusters.
Visualization.
Standard Analysis
Demultiplex BCL files from a sequencer into FASTQs. Alignment, UMI counting, Metrics summary.
Identification of highly variable gene (HVGs).
Cell Subpopulation Identification.
Principal component analysis (PCA).
Identify clusters of cells.
Dimensionality reduction and Visualization.
Marker gene detection (Differentially expression analysis between clusters).
GO/KEGG/Reactome Enrichment.
FunctionalAnnotation of Transcription Factor.
Protein-Protein Interaction Network Analysis.

Project Workflow

We support an end-to-end suite of services to ensure that our clients gets the best quality data. This includes a pre-project consultation with our application experts in experimental design, subsequent sample preparation, library construction, sequencing, and bioinformatics analysis.

Project Workflow

Sequencing and Analysis

Recommended data outputs and analysis contents displayed are for reference only. For detailed information, please contact us with your customized requests.

Sequencing PlatformIllumina NovaSeq X-Plus Sequencing Platform
Read LengthPaired-end 150 bp
Recommended Data20,000 – 50,000 read pairs/cell, 100-120Gb/sample
AnalysisCell Ranger Analysis
Demultiplex BCL files from a sequencer into FASTQs.
Summary metrics (sequencing quality, number of cells detected, the mean reads per cell, and the median genes detected per cell et al.).
Alignment of reads to genome.
Gene expression quantification.
Clustering analysis.
Differentially expression analysis between clusters.
Visualization.
Standard Analysis
Demultiplex BCL files from a sequencer into FASTQs. Alignment, UMI counting, Metrics summary.
Identification of highly variable gene (HVGs).
Cell Subpopulation Identification.
Principal component analysis (PCA).
Identify clusters of cells.
Dimensionality reduction and Visualization.
Marker gene detection (Differentially expression analysis between clusters).
GO/KEGG/Reactome Enrichment.
FunctionalAnnotation of Transcription Factor.
Protein-Protein Interaction Network Analysis.

Project Workflow

We support an end-to-end suite of services to ensure that our clients gets the best quality data. This includes a pre-project consultation with our application experts in experimental design, subsequent sample preparation, library construction, sequencing, and bioinformatics analysis.

Project Workflow

Demo Results

Image
Image
Image
Image
1/2
Cell Clusters

T-distributed stochastic neighbor embedding (t-SNE) and uniform manifold approximation and projection (UMAP) visualization of cell clusters. Compared to t-SNE, the UMAP visualization tends to have more compact visual clusters with more empty spaces between them.

Note:Each point represents a cell, and each color designates a cluster.

Image
Image
1/1
Expression Pattern of Marker Genes

Heatmaps show the expression of indicated marker genes for given cells and features. In this case, we plotted the top 10 markers (or all markers if less than 10) for each cluster.

Note: Darker red represents a higher expression level, and darker blue dictates a lower expression level.

Image
Image
Image
Image
Image
Image
Image
Image
Image
Image
Image
Image
1/6
Expression Level of Marker Genes

Violin plots show the relative expression levels of marker genes among all clusters. (Only six marker genes are shown here).

Note: The X-axis represents the cluster, and the Y-axis represents the expression level.

Demo Results

Image
Image
Image
Image
1/2
Cell Clusters

T-distributed stochastic neighbor embedding (t-SNE) and uniform manifold approximation and projection (UMAP) visualization of cell clusters. Compared to t-SNE, the UMAP visualization tends to have more compact visual clusters with more empty spaces between them.

Note:Each point represents a cell, and each color designates a cluster.

Image
Image
1/1
Expression Pattern of Marker Genes

Heatmaps show the expression of indicated marker genes for given cells and features. In this case, we plotted the top 10 markers (or all markers if less than 10) for each cluster.

Note: Darker red represents a higher expression level, and darker blue dictates a lower expression level.

Image
Image
Image
Image
Image
Image
Image
Image
Image
Image
Image
Image
1/6
Expression Level of Marker Genes

Violin plots show the relative expression levels of marker genes among all clusters. (Only six marker genes are shown here).

Note: The X-axis represents the cluster, and the Y-axis represents the expression level.

Image
Image
Image
Image
1/2
Cell Clusters

T-distributed stochastic neighbor embedding (t-SNE) and uniform manifold approximation and projection (UMAP) visualization of cell clusters. Compared to t-SNE, the UMAP visualization tends to have more compact visual clusters with more empty spaces between them.

Note:Each point represents a cell, and each color designates a cluster.

Image
Image
1/1
Expression Pattern of Marker Genes

Heatmaps show the expression of indicated marker genes for given cells and features. In this case, we plotted the top 10 markers (or all markers if less than 10) for each cluster.

Note: Darker red represents a higher expression level, and darker blue dictates a lower expression level.

Image
Image
Image
Image
Image
Image
Image
Image
Image
Image
Image
Image
1/6
Expression Level of Marker Genes

Violin plots show the relative expression levels of marker genes among all clusters. (Only six marker genes are shown here).

Note: The X-axis represents the cluster, and the Y-axis represents the expression level.

More Services

Visium HD Spatial Gene Expression
(Visium HD Spatial Gene Expression)
Visium HD Spatial Gene Expression
(Visium HD Spatial Gene Expression)
Single Cell Immune Profiling Sequencing
(Single Cell Immune Profiling Sequencing)
Single Cell Immune Profiling Sequencing
(Single Cell Immune Profiling Sequencing)
Single Cell Long Read Transcriptome
(Single Cell Long Read Transcriptome)
Single Cell Long Read Transcriptome
(Single Cell Long Read Transcriptome)

More Services

Visium HD Spatial Gene Expression
(Visium HD Spatial Gene Expression)
Visium HD Spatial Gene Expression
(Visium HD Spatial Gene Expression)
Single Cell Immune Profiling Sequencing
(Single Cell Immune Profiling Sequencing)
Single Cell Immune Profiling Sequencing
(Single Cell Immune Profiling Sequencing)
Single Cell Long Read Transcriptome
(Single Cell Long Read Transcriptome)
Single Cell Long Read Transcriptome
(Single Cell Long Read Transcriptome)
Background
Background

Ready to Start Your Project?

Our platform offers tailored solutions for

your unique experimental needs, ensuring a seamless experience from project design to data delivery.


Privacy PolicyCookie PolicyCareers