Novogene AMEA
  • Novogene AMEA
  • Genomics
    • Human Whole Genome Sequencing
    • Plant and Animal Whole Genome Sequencing
    • Microbial Whole Genome Sequencing
    • Plant and Animal De novo Sequencing
    • Microbial De novo Sequencing
    • Shotgun Metagenomics Sequencing
    • Amplicon Sequencing
    • Whole Exome Sequencing
    Transcriptomics
    • mRNA Sequencing
    • Total RNA Sequencing
    • Full-Length Transcriptome Sequencing
    • Whole Transcriptome Sequencing
    • Small RNA Sequencing
    • Circular RNA Sequencing
    • Metatranscriptome Sequencing
    • Prokaryotic RNA Sequencing
    Single Cell & Spatial Omics
    • Single Cell Gene Expression
    • Single Cell Immune Profiling Sequencing
    • Single Cell Long Read Transcriptome
    • Visium HD Spatial Gene Expression
    • Stereo-Seq Spatial Gene Expression
    • Xenium In Situ Spatial Transcriptome
    Epigenomics
    • Whole Genome Bisulfite Sequencing (WGBS)
    • Directed DNA Methylation Sequencing (DM-Seq) NEW
    • Reduced Representation Bisulfite Sequencing (RRBS)
    • Chromatin Immunoprecipitation Sequencing (ChIP-seq)
    • RNA Immunoprecipitation Sequencing (RIP-seq)
    • Assay for Transposase-Accessible Chromatin with Sequencing (ATAC-seq)

    Premade Library

    • Sequencing Only on Illumina Sequencer
    • Sequencing Only on PacBio Sequencer
    Proteomics and Metabolomics
    • Olink Proteomics
    • Quantitative Proteomics
    • Untargeted Metabolomics
  • PromotionsPromotions
    • Platforms
    • Automated Delivery Platform (Falcon)
    • Bioinformatics Analysis Tool (NovoMagic)
    • Customer Service System (CSS)
    • Brochures
    • Case Studies
    • Webinar
    • Blog
    • Sample Guidelines
    • Cancer Research
    • Immuno-oncology
    • Agrigenomics
    • Environment
    • Food Science
    • Human Microbiome
    • Plant and Animal Microbiome
    • Drug Discovery and Development
    • Rare and Complex Diseases
    • About Us
    • Our Locations
    • News
    • Careers
  • Contact UsContact Us

ServicesServices menu

SupportSupport menu

CompanyCompany menu

Services
Whole Genome SequencingDe novo SequencingAmplicon SequencingShotgun Metagenomic SequencingDirected DNA Methylation Sequencing (DM-Seq)mRNA SequencingSingle Cell Gene ExpressionVisium HD Spatial Gene ExpressionXenium In Situ Spatial TranscriptomeOlink ProteomicsUntargeted Metabolomics
Support
NovoMagic Bioinformatics Analysis ToolCustomer Service SystemFalcon Intelligent Delivery Platform
Company
About UsOur LocationsOur PlatformsNewsCareersContact Us
LinkedInLinkedIn hoverYouTubeYouTube hoverXX hover
Copyright © 2026 Novogene Inc. All rights reserved.For Research Use Only. Not for Clinical Diagnostic Use.
Novogene AMEA
  • Novogene AMEA
  • Genomics
    • Human Whole Genome Sequencing
    • Plant and Animal Whole Genome Sequencing
    • Microbial Whole Genome Sequencing
    • Plant and Animal De novo Sequencing
    • Microbial De novo Sequencing
    • Shotgun Metagenomics Sequencing
    • Amplicon Sequencing
    • Whole Exome Sequencing
    Transcriptomics
    • mRNA Sequencing
    • Total RNA Sequencing
    • Full-Length Transcriptome Sequencing
    • Whole Transcriptome Sequencing
    • Small RNA Sequencing
    • Circular RNA Sequencing
    • Metatranscriptome Sequencing
    • Prokaryotic RNA Sequencing
    Single Cell & Spatial Omics
    • Single Cell Gene Expression
    • Single Cell Immune Profiling Sequencing
    • Single Cell Long Read Transcriptome
    • Visium HD Spatial Gene Expression
    • Stereo-Seq Spatial Gene Expression
    • Xenium In Situ Spatial Transcriptome
    Epigenomics
    • Whole Genome Bisulfite Sequencing (WGBS)
    • Directed DNA Methylation Sequencing (DM-Seq) NEW
    • Reduced Representation Bisulfite Sequencing (RRBS)
    • Chromatin Immunoprecipitation Sequencing (ChIP-seq)
    • RNA Immunoprecipitation Sequencing (RIP-seq)
    • Assay for Transposase-Accessible Chromatin with Sequencing (ATAC-seq)

    Premade Library

    • Sequencing Only on Illumina Sequencer
    • Sequencing Only on PacBio Sequencer
    Proteomics and Metabolomics
    • Olink Proteomics
    • Quantitative Proteomics
    • Untargeted Metabolomics
  • PromotionsPromotions
    • Platforms
    • Automated Delivery Platform (Falcon)
    • Bioinformatics Analysis Tool (NovoMagic)
    • Customer Service System (CSS)
    • Brochures
    • Case Studies
    • Webinar
    • Blog
    • Sample Guidelines
    • Cancer Research
    • Immuno-oncology
    • Agrigenomics
    • Environment
    • Food Science
    • Human Microbiome
    • Plant and Animal Microbiome
    • Drug Discovery and Development
    • Rare and Complex Diseases
    • About Us
    • Our Locations
    • News
    • Careers
  • Contact UsContact Us

ServicesServices menu

SupportSupport menu

CompanyCompany menu

Services
Whole Genome SequencingDe novo SequencingAmplicon SequencingShotgun Metagenomic SequencingDirected DNA Methylation Sequencing (DM-Seq)mRNA SequencingSingle Cell Gene ExpressionVisium HD Spatial Gene ExpressionXenium In Situ Spatial TranscriptomeOlink ProteomicsUntargeted Metabolomics
Support
NovoMagic Bioinformatics Analysis ToolCustomer Service SystemFalcon Intelligent Delivery Platform
Company
About UsOur LocationsOur PlatformsNewsCareersContact Us
LinkedInLinkedIn hoverYouTubeYouTube hoverXX hover
Copyright © 2026 Novogene Inc. All rights reserved.For Research Use Only. Not for Clinical Diagnostic Use.
banner laptop bg
banner mobile bg

Stereo-Seq Spatial Gene Expression

Request a Quote
(Stereo-Seq Spatial Gene Expression)
Request a Quote
(Stereo-Seq Spatial Gene Expression)
OverviewOverview
BenefitsBenefits
ApplicationsApplications
SpecificationsSpecifications
ResourcesResources

STOmics’ flagship technology, Spatial Enhanced Resolution Omics-sequencing (Stereo-seq), is an advanced spatial transcriptomics platform based on DNA Nano Ball (DNB) technology. This cutting-edge system offers unparalleled resolution, throughput, and field of view, enabling comprehensive spatial transcriptomic analysis across multiple scales — tissue, cellular, subcellular, and molecular levels. Using a patterned array chip and Coordinate ID (CID) system, Stereo-seq captures mRNA directly from tissue samples, restoring its precise spatial coordinates. As a transformative tool, Stereo-seq empowers researchers to elucidate the complex relationships between gene expression, cell morphology, and their local microenvironments.

Why Choose Novogene for Stereo-Seq Spatial Gene Expression Sequencing?

 Large Area High Resolution
Large Area High Resolution

500 nm resolution with up to 13 cm × 13 cm capture area for gene and imaging analysis

 Large Area High Resolution
Large Area High Resolution

500 nm resolution with up to 13 cm × 13 cm capture area for gene and imaging analysis

Broad Sample Compatibility

Compatible with fresh-frozen and FFPE samples across diverse animal and plant tissue types

Broad Sample Compatibility

Compatible with fresh-frozen and FFPE samples across diverse animal and plant tissue types

Pathology Integration

Single-section staining enables simultaneous pathological assessment and spatial transcriptomics analysis

Pathology Integration

Single-section staining enables simultaneous pathological assessment and spatial transcriptomics analysis

Why Choose Novogene for Stereo-Seq Spatial Gene Expression Sequencing?

 Large Area High Resolution
Large Area High Resolution

500 nm resolution with up to 13 cm × 13 cm capture area for gene and imaging analysis

 Large Area High Resolution
Large Area High Resolution

500 nm resolution with up to 13 cm × 13 cm capture area for gene and imaging analysis

Broad Sample Compatibility

Compatible with fresh-frozen and FFPE samples across diverse animal and plant tissue types

Broad Sample Compatibility

Compatible with fresh-frozen and FFPE samples across diverse animal and plant tissue types

Pathology Integration

Single-section staining enables simultaneous pathological assessment and spatial transcriptomics analysis

Pathology Integration

Single-section staining enables simultaneous pathological assessment and spatial transcriptomics analysis

Applications of Stereo-Seq Spatial Gene Expression

Unlock comprehensive insights into human genetics for hereditary disease, cancer, and population studies.

Tumor Microenvironment Research

Characterize the molecular and cellular landscape of the tumor microenvironment.

Tumor Microenvironment Research

Characterize the molecular and cellular landscape of the tumor microenvironment.

Immunology

Map the spatial distribution and interactions of immune cells within tissues.

Immunology

Map the spatial distribution and interactions of immune cells within tissues.

Neuroscience

Investigate neural cell function and expression patterns at unprecedented resolution.

Neuroscience

Investigate neural cell function and expression patterns at unprecedented resolution.

Biomarker Discovery

Identify cell-specific biomarkers for disease diagnosis and therapy development.

Biomarker Discovery

Identify cell-specific biomarkers for disease diagnosis and therapy development.

Applications of Stereo-Seq Spatial Gene Expression

Unlock comprehensive insights into human genetics for hereditary disease, cancer, and population studies.

Tumor Microenvironment Research

Characterize the molecular and cellular landscape of the tumor microenvironment.

Tumor Microenvironment Research

Characterize the molecular and cellular landscape of the tumor microenvironment.

Immunology

Map the spatial distribution and interactions of immune cells within tissues.

Immunology

Map the spatial distribution and interactions of immune cells within tissues.

Neuroscience

Investigate neural cell function and expression patterns at unprecedented resolution.

Neuroscience

Investigate neural cell function and expression patterns at unprecedented resolution.

Biomarker Discovery

Identify cell-specific biomarkers for disease diagnosis and therapy development.

Biomarker Discovery

Identify cell-specific biomarkers for disease diagnosis and therapy development.

Specifications

Sample Requirements

Sample amounts are listed for reference only. Download the Sample Requirements to learn more. For detailed information, please contact us with your customized requests.

Sample TypeSample AmountPreservationSample QCShipping
FFPE block (recommended)*1 block, FFPE block must be contained on plastic dehydrating box, otherwise could not be installed on the sectioning deviceAfter embedding store at 4°C, protected from lightDV200% ≥ 30%Cold pack transportation
FFPE sections10-15 FFPE (5μm thickness) scrolls in 1.5mL tube for sample QC;
4-6 FFPE (5μm thickness) tissue sections, place each FFPE sections into a new 50 ml centrifuge tubes for library prep
Dry and sealed,storage time at 4°C< 14 days
Fresh Frozen (OCT-embedded block)For samples with a thickness greater than 1mm, the area should be less than 0.9cm × 0.9cmAfter embedding store at -80°C , mark the cutting surface on the outside of the embedding boxRIN ≥ 4Dry ice transportation
*FFPE blocks should be no older than 3 years.

Sample Requirements

Sample amounts are listed for reference only. Download the Sample Requirements to learn more. For detailed information, please contact us with your customized requests.

Sample TypeSample AmountPreservationSample QCShipping
FFPE block (recommended)*1 block, FFPE block must be contained on plastic dehydrating box, otherwise could not be installed on the sectioning deviceAfter embedding store at 4°C, protected from lightDV200% ≥ 30%Cold pack transportation
FFPE sections10-15 FFPE (5μm thickness) scrolls in 1.5mL tube for sample QC;
4-6 FFPE (5μm thickness) tissue sections, place each FFPE sections into a new 50 ml centrifuge tubes for library prep
Dry and sealed,storage time at 4°C< 14 days
Fresh Frozen (OCT-embedded block)For samples with a thickness greater than 1mm, the area should be less than 0.9cm × 0.9cmAfter embedding store at -80°C , mark the cutting surface on the outside of the embedding boxRIN ≥ 4Dry ice transportation
*FFPE blocks should be no older than 3 years.

Sample Requirements

Sample amounts are listed for reference only. Download the Sample Requirements to learn more. For detailed information, please contact us with your customized requests.

Sample TypeSample AmountPreservationSample QCShipping
FFPE block (recommended)*1 block, FFPE block must be contained on plastic dehydrating box, otherwise could not be installed on the sectioning deviceAfter embedding store at 4°C, protected from lightDV200% ≥ 30%Cold pack transportation
FFPE sections10-15 FFPE (5μm thickness) scrolls in 1.5mL tube for sample QC;
4-6 FFPE (5μm thickness) tissue sections, place each FFPE sections into a new 50 ml centrifuge tubes for library prep
Dry and sealed,storage time at 4°C< 14 days
Fresh Frozen (OCT-embedded block)For samples with a thickness greater than 1mm, the area should be less than 0.9cm × 0.9cmAfter embedding store at -80°C , mark the cutting surface on the outside of the embedding boxRIN ≥ 4Dry ice transportation
*FFPE blocks should be no older than 3 years.

Sample Requirements

Sample amounts are listed for reference only. Download the Sample Requirements to learn more. For detailed information, please contact us with your customized requests.

Sample TypeSample AmountPreservationSample QCShipping
FFPE block (recommended)*1 block, FFPE block must be contained on plastic dehydrating box, otherwise could not be installed on the sectioning deviceAfter embedding store at 4°C, protected from lightDV200% ≥ 30%Cold pack transportation
FFPE sections10-15 FFPE (5μm thickness) scrolls in 1.5mL tube for sample QC;
4-6 FFPE (5μm thickness) tissue sections, place each FFPE sections into a new 50 ml centrifuge tubes for library prep
Dry and sealed,storage time at 4°C< 14 days
Fresh Frozen (OCT-embedded block)For samples with a thickness greater than 1mm, the area should be less than 0.9cm × 0.9cmAfter embedding store at -80°C , mark the cutting surface on the outside of the embedding boxRIN ≥ 4Dry ice transportation
*FFPE blocks should be no older than 3 years.

Sequencing and Analysis

Recommended data outputs and analysis contents displayed are for reference only. For detailed information, please contact us with your customized requests.

Tissue TypeStereo - FFPEStereo - Fresh Frozen
Capture methodRandom probe capturePolyA capture
Resolution500nm500nm
Sequencing platformBGI DNB-SEQ T7BGI DNB-SEQ T7
Read lengthPE 50bp+100bpPE 50bp+100bp
Recommended Data AmountCoverage Area 1cm*1cm~ 3000 Million reads/sample
Coverage Area 0.5m*0.5cm~ 1000 Million reads/sample
Coverage Area 1cm*1cm~ 2000 Million reads/sample
Coverage Area 0.5cm*0.5cm~ 1000 Million reads/sample
AnalysisData QC
Mapping and Quantification
Dimensionality Reduction, Clustering, and Differential analysis:
Graphclust clustering
K-means clustering
Seurat Analysis:
PCA analysis
Spatial variable gene expression analysis
Clustering and dimensionality reduction analysis
Differential Expression Gene Analysis (DEG)
DEGs clustering heatmap
Spatial distribution of DEGs
Violine plot
t-SNE and UMAP dimensional reduction visualization
Functional Enrichment Analysis:
GO enrichment
KEGG enrichment
Reactome enrichment

Project Workflow

Project Workflow

Sequencing and Analysis

Recommended data outputs and analysis contents displayed are for reference only. For detailed information, please contact us with your customized requests.

Tissue TypeStereo - FFPEStereo - Fresh Frozen
Capture methodRandom probe capturePolyA capture
Resolution500nm500nm
Sequencing platformBGI DNB-SEQ T7BGI DNB-SEQ T7
Read lengthPE 50bp+100bpPE 50bp+100bp
Recommended Data AmountCoverage Area 1cm*1cm~ 3000 Million reads/sample
Coverage Area 0.5m*0.5cm~ 1000 Million reads/sample
Coverage Area 1cm*1cm~ 2000 Million reads/sample
Coverage Area 0.5cm*0.5cm~ 1000 Million reads/sample
AnalysisData QC
Mapping and Quantification
Dimensionality Reduction, Clustering, and Differential analysis:
Graphclust clustering
K-means clustering
Seurat Analysis:
PCA analysis
Spatial variable gene expression analysis
Clustering and dimensionality reduction analysis
Differential Expression Gene Analysis (DEG)
DEGs clustering heatmap
Spatial distribution of DEGs
Violine plot
t-SNE and UMAP dimensional reduction visualization
Functional Enrichment Analysis:
GO enrichment
KEGG enrichment
Reactome enrichment

Project Workflow

Project Workflow

Sequencing and Analysis

Recommended data outputs and analysis contents displayed are for reference only. For detailed information, please contact us with your customized requests.

Tissue TypeStereo - FFPEStereo - Fresh Frozen
Capture methodRandom probe capturePolyA capture
Resolution500nm500nm
Sequencing platformBGI DNB-SEQ T7BGI DNB-SEQ T7
Read lengthPE 50bp+100bpPE 50bp+100bp
Recommended Data AmountCoverage Area 1cm*1cm~ 3000 Million reads/sample
Coverage Area 0.5m*0.5cm~ 1000 Million reads/sample
Coverage Area 1cm*1cm~ 2000 Million reads/sample
Coverage Area 0.5cm*0.5cm~ 1000 Million reads/sample
AnalysisData QC
Mapping and Quantification
Dimensionality Reduction, Clustering, and Differential analysis:
Graphclust clustering
K-means clustering
Seurat Analysis:
PCA analysis
Spatial variable gene expression analysis
Clustering and dimensionality reduction analysis
Differential Expression Gene Analysis (DEG)
DEGs clustering heatmap
Spatial distribution of DEGs
Violine plot
t-SNE and UMAP dimensional reduction visualization
Functional Enrichment Analysis:
GO enrichment
KEGG enrichment
Reactome enrichment

Project Workflow

Project Workflow

Sequencing and Analysis

Recommended data outputs and analysis contents displayed are for reference only. For detailed information, please contact us with your customized requests.

Tissue TypeStereo - FFPEStereo - Fresh Frozen
Capture methodRandom probe capturePolyA capture
Resolution500nm500nm
Sequencing platformBGI DNB-SEQ T7BGI DNB-SEQ T7
Read lengthPE 50bp+100bpPE 50bp+100bp
Recommended Data AmountCoverage Area 1cm*1cm~ 3000 Million reads/sample
Coverage Area 0.5m*0.5cm~ 1000 Million reads/sample
Coverage Area 1cm*1cm~ 2000 Million reads/sample
Coverage Area 0.5cm*0.5cm~ 1000 Million reads/sample
AnalysisData QC
Mapping and Quantification
Dimensionality Reduction, Clustering, and Differential analysis:
Graphclust clustering
K-means clustering
Seurat Analysis:
PCA analysis
Spatial variable gene expression analysis
Clustering and dimensionality reduction analysis
Differential Expression Gene Analysis (DEG)
DEGs clustering heatmap
Spatial distribution of DEGs
Violine plot
t-SNE and UMAP dimensional reduction visualization
Functional Enrichment Analysis:
GO enrichment
KEGG enrichment
Reactome enrichment

Project Workflow

Project Workflow

Specifications

Sample Requirements

Sample amounts are listed for reference only. Download the Sample Requirements to learn more. For detailed information, please contact us with your customized requests.

Sample TypeSample AmountPreservationSample QCShipping
FFPE block (recommended)*1 block, FFPE block must be contained on plastic dehydrating box, otherwise could not be installed on the sectioning deviceAfter embedding store at 4°C, protected from lightDV200% ≥ 30%Cold pack transportation
FFPE sections10-15 FFPE (5μm thickness) scrolls in 1.5mL tube for sample QC;
4-6 FFPE (5μm thickness) tissue sections, place each FFPE sections into a new 50 ml centrifuge tubes for library prep
Dry and sealed,storage time at 4°C< 14 days
Fresh Frozen (OCT-embedded block)For samples with a thickness greater than 1mm, the area should be less than 0.9cm × 0.9cmAfter embedding store at -80°C , mark the cutting surface on the outside of the embedding boxRIN ≥ 4Dry ice transportation
*FFPE blocks should be no older than 3 years.

Sample Requirements

Sample amounts are listed for reference only. Download the Sample Requirements to learn more. For detailed information, please contact us with your customized requests.

Sample TypeSample AmountPreservationSample QCShipping
FFPE block (recommended)*1 block, FFPE block must be contained on plastic dehydrating box, otherwise could not be installed on the sectioning deviceAfter embedding store at 4°C, protected from lightDV200% ≥ 30%Cold pack transportation
FFPE sections10-15 FFPE (5μm thickness) scrolls in 1.5mL tube for sample QC;
4-6 FFPE (5μm thickness) tissue sections, place each FFPE sections into a new 50 ml centrifuge tubes for library prep
Dry and sealed,storage time at 4°C< 14 days
Fresh Frozen (OCT-embedded block)For samples with a thickness greater than 1mm, the area should be less than 0.9cm × 0.9cmAfter embedding store at -80°C , mark the cutting surface on the outside of the embedding boxRIN ≥ 4Dry ice transportation
*FFPE blocks should be no older than 3 years.

Sample Requirements

Sample amounts are listed for reference only. Download the Sample Requirements to learn more. For detailed information, please contact us with your customized requests.

Sample TypeSample AmountPreservationSample QCShipping
FFPE block (recommended)*1 block, FFPE block must be contained on plastic dehydrating box, otherwise could not be installed on the sectioning deviceAfter embedding store at 4°C, protected from lightDV200% ≥ 30%Cold pack transportation
FFPE sections10-15 FFPE (5μm thickness) scrolls in 1.5mL tube for sample QC;
4-6 FFPE (5μm thickness) tissue sections, place each FFPE sections into a new 50 ml centrifuge tubes for library prep
Dry and sealed,storage time at 4°C< 14 days
Fresh Frozen (OCT-embedded block)For samples with a thickness greater than 1mm, the area should be less than 0.9cm × 0.9cmAfter embedding store at -80°C , mark the cutting surface on the outside of the embedding boxRIN ≥ 4Dry ice transportation
*FFPE blocks should be no older than 3 years.

Sample Requirements

Sample amounts are listed for reference only. Download the Sample Requirements to learn more. For detailed information, please contact us with your customized requests.

Sample TypeSample AmountPreservationSample QCShipping
FFPE block (recommended)*1 block, FFPE block must be contained on plastic dehydrating box, otherwise could not be installed on the sectioning deviceAfter embedding store at 4°C, protected from lightDV200% ≥ 30%Cold pack transportation
FFPE sections10-15 FFPE (5μm thickness) scrolls in 1.5mL tube for sample QC;
4-6 FFPE (5μm thickness) tissue sections, place each FFPE sections into a new 50 ml centrifuge tubes for library prep
Dry and sealed,storage time at 4°C< 14 days
Fresh Frozen (OCT-embedded block)For samples with a thickness greater than 1mm, the area should be less than 0.9cm × 0.9cmAfter embedding store at -80°C , mark the cutting surface on the outside of the embedding boxRIN ≥ 4Dry ice transportation
*FFPE blocks should be no older than 3 years.

Sequencing and Analysis

Recommended data outputs and analysis contents displayed are for reference only. For detailed information, please contact us with your customized requests.

Tissue TypeStereo - FFPEStereo - Fresh Frozen
Capture methodRandom probe capturePolyA capture
Resolution500nm500nm
Sequencing platformBGI DNB-SEQ T7BGI DNB-SEQ T7
Read lengthPE 50bp+100bpPE 50bp+100bp
Recommended Data AmountCoverage Area 1cm*1cm~ 3000 Million reads/sample
Coverage Area 0.5m*0.5cm~ 1000 Million reads/sample
Coverage Area 1cm*1cm~ 2000 Million reads/sample
Coverage Area 0.5cm*0.5cm~ 1000 Million reads/sample
AnalysisData QC
Mapping and Quantification
Dimensionality Reduction, Clustering, and Differential analysis:
Graphclust clustering
K-means clustering
Seurat Analysis:
PCA analysis
Spatial variable gene expression analysis
Clustering and dimensionality reduction analysis
Differential Expression Gene Analysis (DEG)
DEGs clustering heatmap
Spatial distribution of DEGs
Violine plot
t-SNE and UMAP dimensional reduction visualization
Functional Enrichment Analysis:
GO enrichment
KEGG enrichment
Reactome enrichment

Project Workflow

Project Workflow

Sequencing and Analysis

Recommended data outputs and analysis contents displayed are for reference only. For detailed information, please contact us with your customized requests.

Tissue TypeStereo - FFPEStereo - Fresh Frozen
Capture methodRandom probe capturePolyA capture
Resolution500nm500nm
Sequencing platformBGI DNB-SEQ T7BGI DNB-SEQ T7
Read lengthPE 50bp+100bpPE 50bp+100bp
Recommended Data AmountCoverage Area 1cm*1cm~ 3000 Million reads/sample
Coverage Area 0.5m*0.5cm~ 1000 Million reads/sample
Coverage Area 1cm*1cm~ 2000 Million reads/sample
Coverage Area 0.5cm*0.5cm~ 1000 Million reads/sample
AnalysisData QC
Mapping and Quantification
Dimensionality Reduction, Clustering, and Differential analysis:
Graphclust clustering
K-means clustering
Seurat Analysis:
PCA analysis
Spatial variable gene expression analysis
Clustering and dimensionality reduction analysis
Differential Expression Gene Analysis (DEG)
DEGs clustering heatmap
Spatial distribution of DEGs
Violine plot
t-SNE and UMAP dimensional reduction visualization
Functional Enrichment Analysis:
GO enrichment
KEGG enrichment
Reactome enrichment

Project Workflow

Project Workflow

Sequencing and Analysis

Recommended data outputs and analysis contents displayed are for reference only. For detailed information, please contact us with your customized requests.

Tissue TypeStereo - FFPEStereo - Fresh Frozen
Capture methodRandom probe capturePolyA capture
Resolution500nm500nm
Sequencing platformBGI DNB-SEQ T7BGI DNB-SEQ T7
Read lengthPE 50bp+100bpPE 50bp+100bp
Recommended Data AmountCoverage Area 1cm*1cm~ 3000 Million reads/sample
Coverage Area 0.5m*0.5cm~ 1000 Million reads/sample
Coverage Area 1cm*1cm~ 2000 Million reads/sample
Coverage Area 0.5cm*0.5cm~ 1000 Million reads/sample
AnalysisData QC
Mapping and Quantification
Dimensionality Reduction, Clustering, and Differential analysis:
Graphclust clustering
K-means clustering
Seurat Analysis:
PCA analysis
Spatial variable gene expression analysis
Clustering and dimensionality reduction analysis
Differential Expression Gene Analysis (DEG)
DEGs clustering heatmap
Spatial distribution of DEGs
Violine plot
t-SNE and UMAP dimensional reduction visualization
Functional Enrichment Analysis:
GO enrichment
KEGG enrichment
Reactome enrichment

Project Workflow

Project Workflow

Sequencing and Analysis

Recommended data outputs and analysis contents displayed are for reference only. For detailed information, please contact us with your customized requests.

Tissue TypeStereo - FFPEStereo - Fresh Frozen
Capture methodRandom probe capturePolyA capture
Resolution500nm500nm
Sequencing platformBGI DNB-SEQ T7BGI DNB-SEQ T7
Read lengthPE 50bp+100bpPE 50bp+100bp
Recommended Data AmountCoverage Area 1cm*1cm~ 3000 Million reads/sample
Coverage Area 0.5m*0.5cm~ 1000 Million reads/sample
Coverage Area 1cm*1cm~ 2000 Million reads/sample
Coverage Area 0.5cm*0.5cm~ 1000 Million reads/sample
AnalysisData QC
Mapping and Quantification
Dimensionality Reduction, Clustering, and Differential analysis:
Graphclust clustering
K-means clustering
Seurat Analysis:
PCA analysis
Spatial variable gene expression analysis
Clustering and dimensionality reduction analysis
Differential Expression Gene Analysis (DEG)
DEGs clustering heatmap
Spatial distribution of DEGs
Violine plot
t-SNE and UMAP dimensional reduction visualization
Functional Enrichment Analysis:
GO enrichment
KEGG enrichment
Reactome enrichment

Project Workflow

Project Workflow

Demo Results

Image
Image
1/1
Spatial Quantification of Gene Expression in Bins

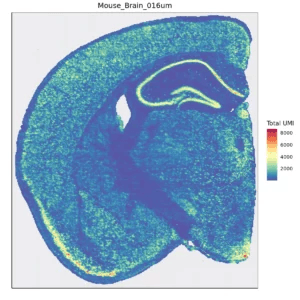
Space Ranger is used to count the UMI for each gene on every bin, obtaining a bin-gene expression matrix for the sample. After performing data QC, the figure below shows the distribution of UMI per gene across the spatial regions of the tissue.

Image
Image
1/1
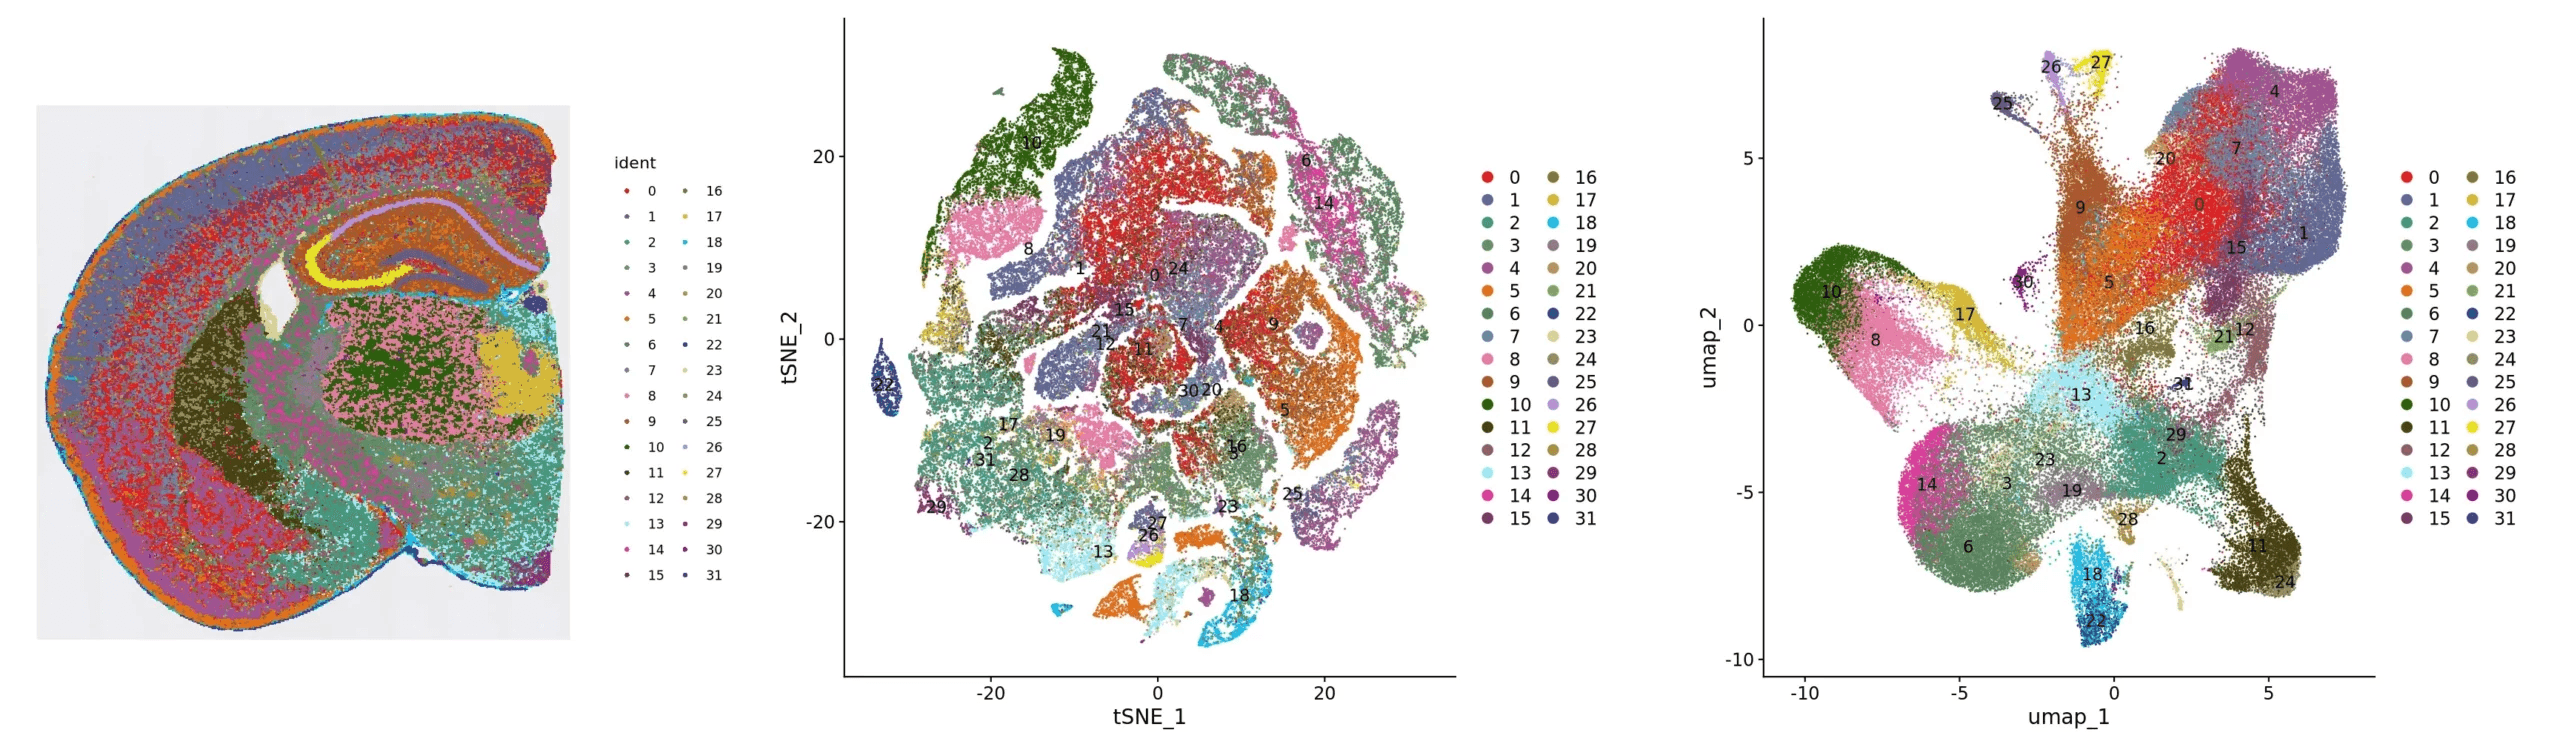
Clustering Analysis Presentation: Spatial Distribution, tSNE and UMAP

Cluster_Spatial: spatial distribution map of clusters; Cluster_tSNE: tSNE two-dimensional spatial representation map of clusters; Cluster_UMAP: UMAP two-dimensional spatial representation map of clusters

Image
Image
1/1
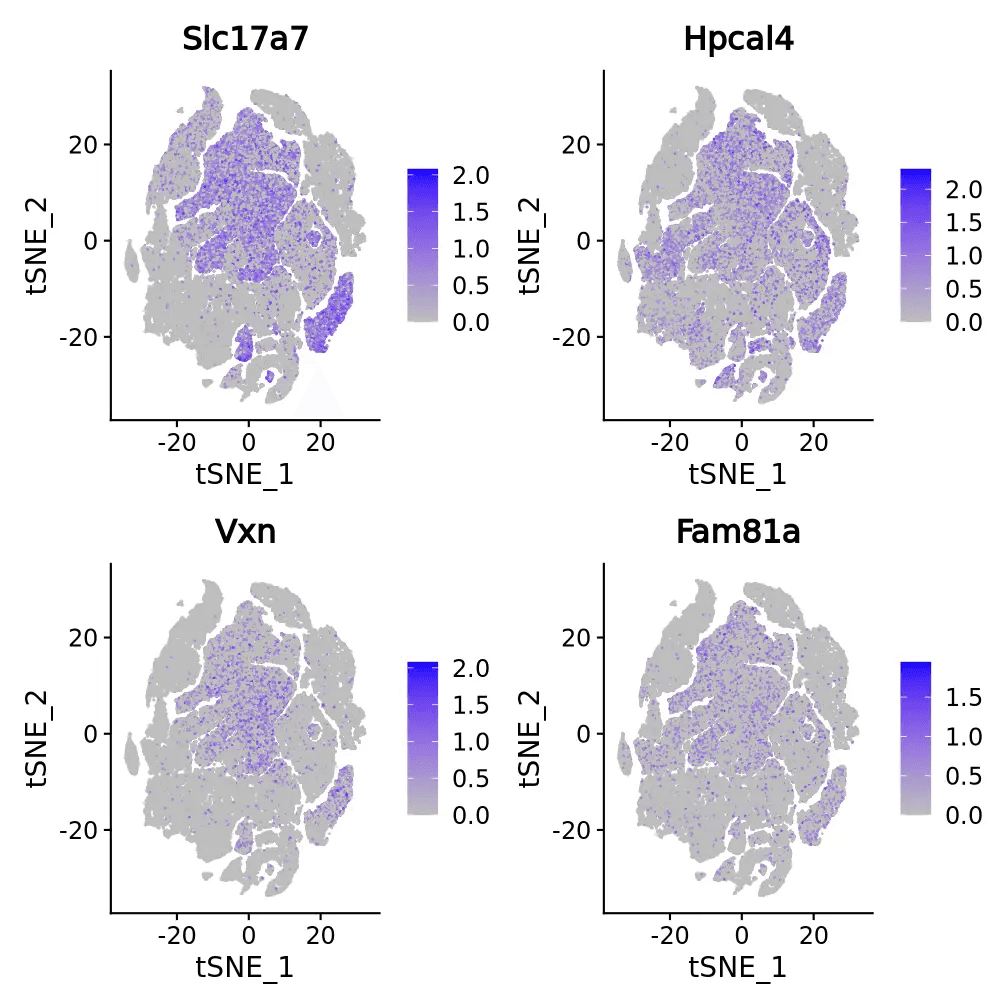
t-SNE and UMAP Dimensionality Reduction of Differentially Expressed Genes

The top 4 differentially expressed genes of each cluster are displayed in several ways. The figure presents the t-SNE and UMAP dimensional reduction visualization of differentially expressed genes.

Demo Results

Image
Image
1/1
Spatial Quantification of Gene Expression in Bins

Space Ranger is used to count the UMI for each gene on every bin, obtaining a bin-gene expression matrix for the sample. After performing data QC, the figure below shows the distribution of UMI per gene across the spatial regions of the tissue.

Image
Image
1/1
Clustering Analysis Presentation: Spatial Distribution, tSNE and UMAP

Cluster_Spatial: spatial distribution map of clusters; Cluster_tSNE: tSNE two-dimensional spatial representation map of clusters; Cluster_UMAP: UMAP two-dimensional spatial representation map of clusters

Image
Image
1/1
t-SNE and UMAP Dimensionality Reduction of Differentially Expressed Genes

The top 4 differentially expressed genes of each cluster are displayed in several ways. The figure presents the t-SNE and UMAP dimensional reduction visualization of differentially expressed genes.

Image
Image
1/1
Spatial Quantification of Gene Expression in Bins

Space Ranger is used to count the UMI for each gene on every bin, obtaining a bin-gene expression matrix for the sample. After performing data QC, the figure below shows the distribution of UMI per gene across the spatial regions of the tissue.

Image
Image
1/1
Clustering Analysis Presentation: Spatial Distribution, tSNE and UMAP

Cluster_Spatial: spatial distribution map of clusters; Cluster_tSNE: tSNE two-dimensional spatial representation map of clusters; Cluster_UMAP: UMAP two-dimensional spatial representation map of clusters

Image
Image
1/1
t-SNE and UMAP Dimensionality Reduction of Differentially Expressed Genes

The top 4 differentially expressed genes of each cluster are displayed in several ways. The figure presents the t-SNE and UMAP dimensional reduction visualization of differentially expressed genes.

More Services

Visium HD Spatial Gene Expression
(Visium HD Spatial Gene Expression)
Visium HD Spatial Gene Expression
(Visium HD Spatial Gene Expression)
Single Cell Gene Expression
(Single Cell Gene Expression)
Single Cell Gene Expression
(Single Cell Gene Expression)
Single Cell Immune Profiling Sequencing
(Single Cell Immune Profiling Sequencing)
Single Cell Immune Profiling Sequencing
(Single Cell Immune Profiling Sequencing)

More Services

Visium HD Spatial Gene Expression
(Visium HD Spatial Gene Expression)
Visium HD Spatial Gene Expression
(Visium HD Spatial Gene Expression)
Single Cell Gene Expression
(Single Cell Gene Expression)
Single Cell Gene Expression
(Single Cell Gene Expression)
Single Cell Immune Profiling Sequencing
(Single Cell Immune Profiling Sequencing)
Single Cell Immune Profiling Sequencing
(Single Cell Immune Profiling Sequencing)
Background
Background

Ready to Start Your Project?

Our platform offers tailored solutions for

your unique experimental needs, ensuring a seamless experience from project design to data delivery.


Privacy PolicyCookie PolicyCareers
banner laptop bg
banner mobile bg

Stereo-Seq Spatial Gene Expression

Request a Quote
(Stereo-Seq Spatial Gene Expression)
Request a Quote
(Stereo-Seq Spatial Gene Expression)
OverviewOverview
BenefitsBenefits
ApplicationsApplications
SpecificationsSpecifications
ResourcesResources

STOmics’ flagship technology, Spatial Enhanced Resolution Omics-sequencing (Stereo-seq), is an advanced spatial transcriptomics platform based on DNA Nano Ball (DNB) technology. This cutting-edge system offers unparalleled resolution, throughput, and field of view, enabling comprehensive spatial transcriptomic analysis across multiple scales — tissue, cellular, subcellular, and molecular levels. Using a patterned array chip and Coordinate ID (CID) system, Stereo-seq captures mRNA directly from tissue samples, restoring its precise spatial coordinates. As a transformative tool, Stereo-seq empowers researchers to elucidate the complex relationships between gene expression, cell morphology, and their local microenvironments.

Why Choose Novogene for Stereo-Seq Spatial Gene Expression Sequencing?

 Large Area High Resolution
Large Area High Resolution

500 nm resolution with up to 13 cm × 13 cm capture area for gene and imaging analysis

 Large Area High Resolution
Large Area High Resolution

500 nm resolution with up to 13 cm × 13 cm capture area for gene and imaging analysis

Broad Sample Compatibility

Compatible with fresh-frozen and FFPE samples across diverse animal and plant tissue types

Broad Sample Compatibility

Compatible with fresh-frozen and FFPE samples across diverse animal and plant tissue types

Pathology Integration

Single-section staining enables simultaneous pathological assessment and spatial transcriptomics analysis

Pathology Integration

Single-section staining enables simultaneous pathological assessment and spatial transcriptomics analysis

Why Choose Novogene for Stereo-Seq Spatial Gene Expression Sequencing?

 Large Area High Resolution
Large Area High Resolution

500 nm resolution with up to 13 cm × 13 cm capture area for gene and imaging analysis

 Large Area High Resolution
Large Area High Resolution

500 nm resolution with up to 13 cm × 13 cm capture area for gene and imaging analysis

Broad Sample Compatibility

Compatible with fresh-frozen and FFPE samples across diverse animal and plant tissue types

Broad Sample Compatibility

Compatible with fresh-frozen and FFPE samples across diverse animal and plant tissue types

Pathology Integration

Single-section staining enables simultaneous pathological assessment and spatial transcriptomics analysis

Pathology Integration

Single-section staining enables simultaneous pathological assessment and spatial transcriptomics analysis

Applications of Stereo-Seq Spatial Gene Expression

Unlock comprehensive insights into human genetics for hereditary disease, cancer, and population studies.

Tumor Microenvironment Research

Characterize the molecular and cellular landscape of the tumor microenvironment.

Tumor Microenvironment Research

Characterize the molecular and cellular landscape of the tumor microenvironment.

Immunology

Map the spatial distribution and interactions of immune cells within tissues.

Immunology

Map the spatial distribution and interactions of immune cells within tissues.

Neuroscience

Investigate neural cell function and expression patterns at unprecedented resolution.

Neuroscience

Investigate neural cell function and expression patterns at unprecedented resolution.

Biomarker Discovery

Identify cell-specific biomarkers for disease diagnosis and therapy development.

Biomarker Discovery

Identify cell-specific biomarkers for disease diagnosis and therapy development.

Applications of Stereo-Seq Spatial Gene Expression

Unlock comprehensive insights into human genetics for hereditary disease, cancer, and population studies.

Tumor Microenvironment Research

Characterize the molecular and cellular landscape of the tumor microenvironment.

Tumor Microenvironment Research

Characterize the molecular and cellular landscape of the tumor microenvironment.

Immunology

Map the spatial distribution and interactions of immune cells within tissues.

Immunology

Map the spatial distribution and interactions of immune cells within tissues.

Neuroscience

Investigate neural cell function and expression patterns at unprecedented resolution.

Neuroscience

Investigate neural cell function and expression patterns at unprecedented resolution.

Biomarker Discovery

Identify cell-specific biomarkers for disease diagnosis and therapy development.

Biomarker Discovery

Identify cell-specific biomarkers for disease diagnosis and therapy development.

Specifications

Sample Requirements

Sample amounts are listed for reference only. Download the Sample Requirements to learn more. For detailed information, please contact us with your customized requests.

Sample TypeSample AmountPreservationSample QCShipping
FFPE block (recommended)*1 block, FFPE block must be contained on plastic dehydrating box, otherwise could not be installed on the sectioning deviceAfter embedding store at 4°C, protected from lightDV200% ≥ 30%Cold pack transportation
FFPE sections10-15 FFPE (5μm thickness) scrolls in 1.5mL tube for sample QC;
4-6 FFPE (5μm thickness) tissue sections, place each FFPE sections into a new 50 ml centrifuge tubes for library prep
Dry and sealed,storage time at 4°C< 14 days
Fresh Frozen (OCT-embedded block)For samples with a thickness greater than 1mm, the area should be less than 0.9cm × 0.9cmAfter embedding store at -80°C , mark the cutting surface on the outside of the embedding boxRIN ≥ 4Dry ice transportation
*FFPE blocks should be no older than 3 years.

Sample Requirements

Sample amounts are listed for reference only. Download the Sample Requirements to learn more. For detailed information, please contact us with your customized requests.

Sample TypeSample AmountPreservationSample QCShipping
FFPE block (recommended)*1 block, FFPE block must be contained on plastic dehydrating box, otherwise could not be installed on the sectioning deviceAfter embedding store at 4°C, protected from lightDV200% ≥ 30%Cold pack transportation
FFPE sections10-15 FFPE (5μm thickness) scrolls in 1.5mL tube for sample QC;
4-6 FFPE (5μm thickness) tissue sections, place each FFPE sections into a new 50 ml centrifuge tubes for library prep
Dry and sealed,storage time at 4°C< 14 days
Fresh Frozen (OCT-embedded block)For samples with a thickness greater than 1mm, the area should be less than 0.9cm × 0.9cmAfter embedding store at -80°C , mark the cutting surface on the outside of the embedding boxRIN ≥ 4Dry ice transportation
*FFPE blocks should be no older than 3 years.

Sample Requirements

Sample amounts are listed for reference only. Download the Sample Requirements to learn more. For detailed information, please contact us with your customized requests.

Sample TypeSample AmountPreservationSample QCShipping
FFPE block (recommended)*1 block, FFPE block must be contained on plastic dehydrating box, otherwise could not be installed on the sectioning deviceAfter embedding store at 4°C, protected from lightDV200% ≥ 30%Cold pack transportation
FFPE sections10-15 FFPE (5μm thickness) scrolls in 1.5mL tube for sample QC;
4-6 FFPE (5μm thickness) tissue sections, place each FFPE sections into a new 50 ml centrifuge tubes for library prep
Dry and sealed,storage time at 4°C< 14 days
Fresh Frozen (OCT-embedded block)For samples with a thickness greater than 1mm, the area should be less than 0.9cm × 0.9cmAfter embedding store at -80°C , mark the cutting surface on the outside of the embedding boxRIN ≥ 4Dry ice transportation
*FFPE blocks should be no older than 3 years.

Sample Requirements

Sample amounts are listed for reference only. Download the Sample Requirements to learn more. For detailed information, please contact us with your customized requests.

Sample TypeSample AmountPreservationSample QCShipping
FFPE block (recommended)*1 block, FFPE block must be contained on plastic dehydrating box, otherwise could not be installed on the sectioning deviceAfter embedding store at 4°C, protected from lightDV200% ≥ 30%Cold pack transportation
FFPE sections10-15 FFPE (5μm thickness) scrolls in 1.5mL tube for sample QC;
4-6 FFPE (5μm thickness) tissue sections, place each FFPE sections into a new 50 ml centrifuge tubes for library prep
Dry and sealed,storage time at 4°C< 14 days
Fresh Frozen (OCT-embedded block)For samples with a thickness greater than 1mm, the area should be less than 0.9cm × 0.9cmAfter embedding store at -80°C , mark the cutting surface on the outside of the embedding boxRIN ≥ 4Dry ice transportation
*FFPE blocks should be no older than 3 years.

Sequencing and Analysis

Recommended data outputs and analysis contents displayed are for reference only. For detailed information, please contact us with your customized requests.

Tissue TypeStereo - FFPEStereo - Fresh Frozen
Capture methodRandom probe capturePolyA capture
Resolution500nm500nm
Sequencing platformBGI DNB-SEQ T7BGI DNB-SEQ T7
Read lengthPE 50bp+100bpPE 50bp+100bp
Recommended Data AmountCoverage Area 1cm*1cm~ 3000 Million reads/sample
Coverage Area 0.5m*0.5cm~ 1000 Million reads/sample
Coverage Area 1cm*1cm~ 2000 Million reads/sample
Coverage Area 0.5cm*0.5cm~ 1000 Million reads/sample
AnalysisData QC
Mapping and Quantification
Dimensionality Reduction, Clustering, and Differential analysis:
Graphclust clustering
K-means clustering
Seurat Analysis:
PCA analysis
Spatial variable gene expression analysis
Clustering and dimensionality reduction analysis
Differential Expression Gene Analysis (DEG)
DEGs clustering heatmap
Spatial distribution of DEGs
Violine plot
t-SNE and UMAP dimensional reduction visualization
Functional Enrichment Analysis:
GO enrichment
KEGG enrichment
Reactome enrichment

Project Workflow

Project Workflow

Sequencing and Analysis

Recommended data outputs and analysis contents displayed are for reference only. For detailed information, please contact us with your customized requests.

Tissue TypeStereo - FFPEStereo - Fresh Frozen
Capture methodRandom probe capturePolyA capture
Resolution500nm500nm
Sequencing platformBGI DNB-SEQ T7BGI DNB-SEQ T7
Read lengthPE 50bp+100bpPE 50bp+100bp
Recommended Data AmountCoverage Area 1cm*1cm~ 3000 Million reads/sample
Coverage Area 0.5m*0.5cm~ 1000 Million reads/sample
Coverage Area 1cm*1cm~ 2000 Million reads/sample
Coverage Area 0.5cm*0.5cm~ 1000 Million reads/sample
AnalysisData QC
Mapping and Quantification
Dimensionality Reduction, Clustering, and Differential analysis:
Graphclust clustering
K-means clustering
Seurat Analysis:
PCA analysis
Spatial variable gene expression analysis
Clustering and dimensionality reduction analysis
Differential Expression Gene Analysis (DEG)
DEGs clustering heatmap
Spatial distribution of DEGs
Violine plot
t-SNE and UMAP dimensional reduction visualization
Functional Enrichment Analysis:
GO enrichment
KEGG enrichment
Reactome enrichment

Project Workflow

Project Workflow

Sequencing and Analysis

Recommended data outputs and analysis contents displayed are for reference only. For detailed information, please contact us with your customized requests.

Tissue TypeStereo - FFPEStereo - Fresh Frozen
Capture methodRandom probe capturePolyA capture
Resolution500nm500nm
Sequencing platformBGI DNB-SEQ T7BGI DNB-SEQ T7
Read lengthPE 50bp+100bpPE 50bp+100bp
Recommended Data AmountCoverage Area 1cm*1cm~ 3000 Million reads/sample
Coverage Area 0.5m*0.5cm~ 1000 Million reads/sample
Coverage Area 1cm*1cm~ 2000 Million reads/sample
Coverage Area 0.5cm*0.5cm~ 1000 Million reads/sample
AnalysisData QC
Mapping and Quantification
Dimensionality Reduction, Clustering, and Differential analysis:
Graphclust clustering
K-means clustering
Seurat Analysis:
PCA analysis
Spatial variable gene expression analysis
Clustering and dimensionality reduction analysis
Differential Expression Gene Analysis (DEG)
DEGs clustering heatmap
Spatial distribution of DEGs
Violine plot
t-SNE and UMAP dimensional reduction visualization
Functional Enrichment Analysis:
GO enrichment
KEGG enrichment
Reactome enrichment

Project Workflow

Project Workflow

Sequencing and Analysis

Recommended data outputs and analysis contents displayed are for reference only. For detailed information, please contact us with your customized requests.

Tissue TypeStereo - FFPEStereo - Fresh Frozen
Capture methodRandom probe capturePolyA capture
Resolution500nm500nm
Sequencing platformBGI DNB-SEQ T7BGI DNB-SEQ T7
Read lengthPE 50bp+100bpPE 50bp+100bp
Recommended Data AmountCoverage Area 1cm*1cm~ 3000 Million reads/sample
Coverage Area 0.5m*0.5cm~ 1000 Million reads/sample
Coverage Area 1cm*1cm~ 2000 Million reads/sample
Coverage Area 0.5cm*0.5cm~ 1000 Million reads/sample
AnalysisData QC
Mapping and Quantification
Dimensionality Reduction, Clustering, and Differential analysis:
Graphclust clustering
K-means clustering
Seurat Analysis:
PCA analysis
Spatial variable gene expression analysis
Clustering and dimensionality reduction analysis
Differential Expression Gene Analysis (DEG)
DEGs clustering heatmap
Spatial distribution of DEGs
Violine plot
t-SNE and UMAP dimensional reduction visualization
Functional Enrichment Analysis:
GO enrichment
KEGG enrichment
Reactome enrichment

Project Workflow

Project Workflow

Specifications

Sample Requirements

Sample amounts are listed for reference only. Download the Sample Requirements to learn more. For detailed information, please contact us with your customized requests.

Sample TypeSample AmountPreservationSample QCShipping
FFPE block (recommended)*1 block, FFPE block must be contained on plastic dehydrating box, otherwise could not be installed on the sectioning deviceAfter embedding store at 4°C, protected from lightDV200% ≥ 30%Cold pack transportation
FFPE sections10-15 FFPE (5μm thickness) scrolls in 1.5mL tube for sample QC;
4-6 FFPE (5μm thickness) tissue sections, place each FFPE sections into a new 50 ml centrifuge tubes for library prep
Dry and sealed,storage time at 4°C< 14 days
Fresh Frozen (OCT-embedded block)For samples with a thickness greater than 1mm, the area should be less than 0.9cm × 0.9cmAfter embedding store at -80°C , mark the cutting surface on the outside of the embedding boxRIN ≥ 4Dry ice transportation
*FFPE blocks should be no older than 3 years.

Sample Requirements

Sample amounts are listed for reference only. Download the Sample Requirements to learn more. For detailed information, please contact us with your customized requests.

Sample TypeSample AmountPreservationSample QCShipping
FFPE block (recommended)*1 block, FFPE block must be contained on plastic dehydrating box, otherwise could not be installed on the sectioning deviceAfter embedding store at 4°C, protected from lightDV200% ≥ 30%Cold pack transportation
FFPE sections10-15 FFPE (5μm thickness) scrolls in 1.5mL tube for sample QC;
4-6 FFPE (5μm thickness) tissue sections, place each FFPE sections into a new 50 ml centrifuge tubes for library prep
Dry and sealed,storage time at 4°C< 14 days
Fresh Frozen (OCT-embedded block)For samples with a thickness greater than 1mm, the area should be less than 0.9cm × 0.9cmAfter embedding store at -80°C , mark the cutting surface on the outside of the embedding boxRIN ≥ 4Dry ice transportation
*FFPE blocks should be no older than 3 years.

Sample Requirements

Sample amounts are listed for reference only. Download the Sample Requirements to learn more. For detailed information, please contact us with your customized requests.

Sample TypeSample AmountPreservationSample QCShipping
FFPE block (recommended)*1 block, FFPE block must be contained on plastic dehydrating box, otherwise could not be installed on the sectioning deviceAfter embedding store at 4°C, protected from lightDV200% ≥ 30%Cold pack transportation
FFPE sections10-15 FFPE (5μm thickness) scrolls in 1.5mL tube for sample QC;
4-6 FFPE (5μm thickness) tissue sections, place each FFPE sections into a new 50 ml centrifuge tubes for library prep
Dry and sealed,storage time at 4°C< 14 days
Fresh Frozen (OCT-embedded block)For samples with a thickness greater than 1mm, the area should be less than 0.9cm × 0.9cmAfter embedding store at -80°C , mark the cutting surface on the outside of the embedding boxRIN ≥ 4Dry ice transportation
*FFPE blocks should be no older than 3 years.

Sample Requirements

Sample amounts are listed for reference only. Download the Sample Requirements to learn more. For detailed information, please contact us with your customized requests.

Sample TypeSample AmountPreservationSample QCShipping
FFPE block (recommended)*1 block, FFPE block must be contained on plastic dehydrating box, otherwise could not be installed on the sectioning deviceAfter embedding store at 4°C, protected from lightDV200% ≥ 30%Cold pack transportation
FFPE sections10-15 FFPE (5μm thickness) scrolls in 1.5mL tube for sample QC;
4-6 FFPE (5μm thickness) tissue sections, place each FFPE sections into a new 50 ml centrifuge tubes for library prep
Dry and sealed,storage time at 4°C< 14 days
Fresh Frozen (OCT-embedded block)For samples with a thickness greater than 1mm, the area should be less than 0.9cm × 0.9cmAfter embedding store at -80°C , mark the cutting surface on the outside of the embedding boxRIN ≥ 4Dry ice transportation
*FFPE blocks should be no older than 3 years.

Sequencing and Analysis

Recommended data outputs and analysis contents displayed are for reference only. For detailed information, please contact us with your customized requests.

Tissue TypeStereo - FFPEStereo - Fresh Frozen
Capture methodRandom probe capturePolyA capture
Resolution500nm500nm
Sequencing platformBGI DNB-SEQ T7BGI DNB-SEQ T7
Read lengthPE 50bp+100bpPE 50bp+100bp
Recommended Data AmountCoverage Area 1cm*1cm~ 3000 Million reads/sample
Coverage Area 0.5m*0.5cm~ 1000 Million reads/sample
Coverage Area 1cm*1cm~ 2000 Million reads/sample
Coverage Area 0.5cm*0.5cm~ 1000 Million reads/sample
AnalysisData QC
Mapping and Quantification
Dimensionality Reduction, Clustering, and Differential analysis:
Graphclust clustering
K-means clustering
Seurat Analysis:
PCA analysis
Spatial variable gene expression analysis
Clustering and dimensionality reduction analysis
Differential Expression Gene Analysis (DEG)
DEGs clustering heatmap
Spatial distribution of DEGs
Violine plot
t-SNE and UMAP dimensional reduction visualization
Functional Enrichment Analysis:
GO enrichment
KEGG enrichment
Reactome enrichment

Project Workflow

Project Workflow

Sequencing and Analysis

Recommended data outputs and analysis contents displayed are for reference only. For detailed information, please contact us with your customized requests.

Tissue TypeStereo - FFPEStereo - Fresh Frozen
Capture methodRandom probe capturePolyA capture
Resolution500nm500nm
Sequencing platformBGI DNB-SEQ T7BGI DNB-SEQ T7
Read lengthPE 50bp+100bpPE 50bp+100bp
Recommended Data AmountCoverage Area 1cm*1cm~ 3000 Million reads/sample
Coverage Area 0.5m*0.5cm~ 1000 Million reads/sample
Coverage Area 1cm*1cm~ 2000 Million reads/sample
Coverage Area 0.5cm*0.5cm~ 1000 Million reads/sample
AnalysisData QC
Mapping and Quantification
Dimensionality Reduction, Clustering, and Differential analysis:
Graphclust clustering
K-means clustering
Seurat Analysis:
PCA analysis
Spatial variable gene expression analysis
Clustering and dimensionality reduction analysis
Differential Expression Gene Analysis (DEG)
DEGs clustering heatmap
Spatial distribution of DEGs
Violine plot
t-SNE and UMAP dimensional reduction visualization
Functional Enrichment Analysis:
GO enrichment
KEGG enrichment
Reactome enrichment

Project Workflow

Project Workflow

Sequencing and Analysis

Recommended data outputs and analysis contents displayed are for reference only. For detailed information, please contact us with your customized requests.

Tissue TypeStereo - FFPEStereo - Fresh Frozen
Capture methodRandom probe capturePolyA capture
Resolution500nm500nm
Sequencing platformBGI DNB-SEQ T7BGI DNB-SEQ T7
Read lengthPE 50bp+100bpPE 50bp+100bp
Recommended Data AmountCoverage Area 1cm*1cm~ 3000 Million reads/sample
Coverage Area 0.5m*0.5cm~ 1000 Million reads/sample
Coverage Area 1cm*1cm~ 2000 Million reads/sample
Coverage Area 0.5cm*0.5cm~ 1000 Million reads/sample
AnalysisData QC
Mapping and Quantification
Dimensionality Reduction, Clustering, and Differential analysis:
Graphclust clustering
K-means clustering
Seurat Analysis:
PCA analysis
Spatial variable gene expression analysis
Clustering and dimensionality reduction analysis
Differential Expression Gene Analysis (DEG)
DEGs clustering heatmap
Spatial distribution of DEGs
Violine plot
t-SNE and UMAP dimensional reduction visualization
Functional Enrichment Analysis:
GO enrichment
KEGG enrichment
Reactome enrichment

Project Workflow

Project Workflow

Sequencing and Analysis

Recommended data outputs and analysis contents displayed are for reference only. For detailed information, please contact us with your customized requests.

Tissue TypeStereo - FFPEStereo - Fresh Frozen
Capture methodRandom probe capturePolyA capture
Resolution500nm500nm
Sequencing platformBGI DNB-SEQ T7BGI DNB-SEQ T7
Read lengthPE 50bp+100bpPE 50bp+100bp
Recommended Data AmountCoverage Area 1cm*1cm~ 3000 Million reads/sample
Coverage Area 0.5m*0.5cm~ 1000 Million reads/sample
Coverage Area 1cm*1cm~ 2000 Million reads/sample
Coverage Area 0.5cm*0.5cm~ 1000 Million reads/sample
AnalysisData QC
Mapping and Quantification
Dimensionality Reduction, Clustering, and Differential analysis:
Graphclust clustering
K-means clustering
Seurat Analysis:
PCA analysis
Spatial variable gene expression analysis
Clustering and dimensionality reduction analysis
Differential Expression Gene Analysis (DEG)
DEGs clustering heatmap
Spatial distribution of DEGs
Violine plot
t-SNE and UMAP dimensional reduction visualization
Functional Enrichment Analysis:
GO enrichment
KEGG enrichment
Reactome enrichment

Project Workflow

Project Workflow

Demo Results

Image
Image
1/1
Spatial Quantification of Gene Expression in Bins

Space Ranger is used to count the UMI for each gene on every bin, obtaining a bin-gene expression matrix for the sample. After performing data QC, the figure below shows the distribution of UMI per gene across the spatial regions of the tissue.

Image
Image
1/1
Clustering Analysis Presentation: Spatial Distribution, tSNE and UMAP

Cluster_Spatial: spatial distribution map of clusters; Cluster_tSNE: tSNE two-dimensional spatial representation map of clusters; Cluster_UMAP: UMAP two-dimensional spatial representation map of clusters

Image
Image
1/1
t-SNE and UMAP Dimensionality Reduction of Differentially Expressed Genes

The top 4 differentially expressed genes of each cluster are displayed in several ways. The figure presents the t-SNE and UMAP dimensional reduction visualization of differentially expressed genes.

Demo Results

Image
Image
1/1
Spatial Quantification of Gene Expression in Bins

Space Ranger is used to count the UMI for each gene on every bin, obtaining a bin-gene expression matrix for the sample. After performing data QC, the figure below shows the distribution of UMI per gene across the spatial regions of the tissue.

Image
Image
1/1
Clustering Analysis Presentation: Spatial Distribution, tSNE and UMAP

Cluster_Spatial: spatial distribution map of clusters; Cluster_tSNE: tSNE two-dimensional spatial representation map of clusters; Cluster_UMAP: UMAP two-dimensional spatial representation map of clusters

Image
Image
1/1
t-SNE and UMAP Dimensionality Reduction of Differentially Expressed Genes

The top 4 differentially expressed genes of each cluster are displayed in several ways. The figure presents the t-SNE and UMAP dimensional reduction visualization of differentially expressed genes.

Image
Image
1/1
Spatial Quantification of Gene Expression in Bins

Space Ranger is used to count the UMI for each gene on every bin, obtaining a bin-gene expression matrix for the sample. After performing data QC, the figure below shows the distribution of UMI per gene across the spatial regions of the tissue.

Image
Image
1/1
Clustering Analysis Presentation: Spatial Distribution, tSNE and UMAP

Cluster_Spatial: spatial distribution map of clusters; Cluster_tSNE: tSNE two-dimensional spatial representation map of clusters; Cluster_UMAP: UMAP two-dimensional spatial representation map of clusters

Image
Image
1/1
t-SNE and UMAP Dimensionality Reduction of Differentially Expressed Genes

The top 4 differentially expressed genes of each cluster are displayed in several ways. The figure presents the t-SNE and UMAP dimensional reduction visualization of differentially expressed genes.

More Services

Visium HD Spatial Gene Expression
(Visium HD Spatial Gene Expression)
Visium HD Spatial Gene Expression
(Visium HD Spatial Gene Expression)
Single Cell Gene Expression
(Single Cell Gene Expression)
Single Cell Gene Expression
(Single Cell Gene Expression)
Single Cell Immune Profiling Sequencing
(Single Cell Immune Profiling Sequencing)
Single Cell Immune Profiling Sequencing
(Single Cell Immune Profiling Sequencing)

More Services

Visium HD Spatial Gene Expression
(Visium HD Spatial Gene Expression)
Visium HD Spatial Gene Expression
(Visium HD Spatial Gene Expression)
Single Cell Gene Expression
(Single Cell Gene Expression)
Single Cell Gene Expression
(Single Cell Gene Expression)
Single Cell Immune Profiling Sequencing
(Single Cell Immune Profiling Sequencing)
Single Cell Immune Profiling Sequencing
(Single Cell Immune Profiling Sequencing)
Background
Background

Ready to Start Your Project?

Our platform offers tailored solutions for

your unique experimental needs, ensuring a seamless experience from project design to data delivery.


Privacy PolicyCookie PolicyCareers