
Novogene AMEA
  • Novogene AMEA
  • Genomics
    • Human Whole Genome Sequencing
    • Plant and Animal Whole Genome Sequencing
    • Microbial Whole Genome Sequencing
    • Plant and Animal De novo Sequencing
    • Microbial De novo Sequencing
    • Shotgun Metagenomics Sequencing
    • Amplicon Sequencing
    • Whole Exome Sequencing
    Transcriptomics
    • mRNA Sequencing
    • Total RNA Sequencing
    • Full-Length Transcriptome Sequencing
    • Whole Transcriptome Sequencing
    • Small RNA Sequencing
    • Circular RNA Sequencing
    • Metatranscriptome Sequencing
    • Prokaryotic RNA Sequencing
    Single Cell & Spatial Omics
    • Single Cell Gene Expression
    • Single Cell Immune Profiling Sequencing
    • Single Cell Long Read Transcriptome
    • Visium HD Spatial Gene Expression
    • Stereo-Seq Spatial Gene Expression
    • Xenium In Situ Spatial Transcriptome
    Epigenomics
    • Whole Genome Bisulfite Sequencing (WGBS)
    • Directed DNA Methylation Sequencing (DM-Seq) NEW
    • Reduced Representation Bisulfite Sequencing (RRBS)
    • Chromatin Immunoprecipitation Sequencing (ChIP-seq)
    • RNA Immunoprecipitation Sequencing (RIP-seq)
    • Assay for Transposase-Accessible Chromatin with Sequencing (ATAC-seq)

    Premade Library

    • Sequencing Only on Illumina Sequencer
    • Sequencing Only on PacBio Sequencer
    Proteomics and Metabolomics
    • Olink Proteomics
    • Quantitative Proteomics
    • Untargeted Metabolomics
  • PromotionsPromotions
    • Platforms
    • Automated Delivery Platform (Falcon)
    • Bioinformatics Analysis Tool (NovoMagic)
    • Customer Service System (CSS)
    • Brochures
    • Case Studies
    • Webinar
    • Blog
    • Sample Guidelines
    • Cancer Research
    • Immuno-oncology
    • Agrigenomics
    • Environment
    • Food Science
    • Human Microbiome
    • Plant and Animal Microbiome
    • Drug Discovery and Development
    • Rare and Complex Diseases
    • About Us
    • Our Locations
    • News
    • Careers
  • Contact UsContact Us

ServicesServices menu

SupportSupport menu

CompanyCompany menu

Services
Whole Genome SequencingDe novo SequencingAmplicon SequencingShotgun Metagenomic SequencingDirected DNA Methylation Sequencing (DM-Seq)mRNA SequencingSingle Cell Gene ExpressionVisium HD Spatial Gene ExpressionXenium In Situ Spatial TranscriptomeOlink ProteomicsUntargeted Metabolomics
Support
NovoMagic Bioinformatics Analysis ToolCustomer Service SystemFalcon Intelligent Delivery Platform
Company
About UsOur LocationsOur PlatformsNewsCareersContact Us
LinkedInLinkedIn hoverYouTubeYouTube hoverXX hover
Copyright © 2026 Novogene Inc. All rights reserved.For Research Use Only. Not for Clinical Diagnostic Use.
Novogene AMEA
  • Novogene AMEA
  • Genomics
    • Human Whole Genome Sequencing
    • Plant and Animal Whole Genome Sequencing
    • Microbial Whole Genome Sequencing
    • Plant and Animal De novo Sequencing
    • Microbial De novo Sequencing
    • Shotgun Metagenomics Sequencing
    • Amplicon Sequencing
    • Whole Exome Sequencing
    Transcriptomics
    • mRNA Sequencing
    • Total RNA Sequencing
    • Full-Length Transcriptome Sequencing
    • Whole Transcriptome Sequencing
    • Small RNA Sequencing
    • Circular RNA Sequencing
    • Metatranscriptome Sequencing
    • Prokaryotic RNA Sequencing
    Single Cell & Spatial Omics
    • Single Cell Gene Expression
    • Single Cell Immune Profiling Sequencing
    • Single Cell Long Read Transcriptome
    • Visium HD Spatial Gene Expression
    • Stereo-Seq Spatial Gene Expression
    • Xenium In Situ Spatial Transcriptome
    Epigenomics
    • Whole Genome Bisulfite Sequencing (WGBS)
    • Directed DNA Methylation Sequencing (DM-Seq) NEW
    • Reduced Representation Bisulfite Sequencing (RRBS)
    • Chromatin Immunoprecipitation Sequencing (ChIP-seq)
    • RNA Immunoprecipitation Sequencing (RIP-seq)
    • Assay for Transposase-Accessible Chromatin with Sequencing (ATAC-seq)

    Premade Library

    • Sequencing Only on Illumina Sequencer
    • Sequencing Only on PacBio Sequencer
    Proteomics and Metabolomics
    • Olink Proteomics
    • Quantitative Proteomics
    • Untargeted Metabolomics
  • PromotionsPromotions
    • Platforms
    • Automated Delivery Platform (Falcon)
    • Bioinformatics Analysis Tool (NovoMagic)
    • Customer Service System (CSS)
    • Brochures
    • Case Studies
    • Webinar
    • Blog
    • Sample Guidelines
    • Cancer Research
    • Immuno-oncology
    • Agrigenomics
    • Environment
    • Food Science
    • Human Microbiome
    • Plant and Animal Microbiome
    • Drug Discovery and Development
    • Rare and Complex Diseases
    • About Us
    • Our Locations
    • News
    • Careers
  • Contact UsContact Us

ServicesServices menu

SupportSupport menu

CompanyCompany menu

Services
Whole Genome SequencingDe novo SequencingAmplicon SequencingShotgun Metagenomic SequencingDirected DNA Methylation Sequencing (DM-Seq)mRNA SequencingSingle Cell Gene ExpressionVisium HD Spatial Gene ExpressionXenium In Situ Spatial TranscriptomeOlink ProteomicsUntargeted Metabolomics
Support
NovoMagic Bioinformatics Analysis ToolCustomer Service SystemFalcon Intelligent Delivery Platform
Company
About UsOur LocationsOur PlatformsNewsCareersContact Us
LinkedInLinkedIn hoverYouTubeYouTube hoverXX hover
Copyright © 2026 Novogene Inc. All rights reserved.For Research Use Only. Not for Clinical Diagnostic Use.
banner laptop bg
banner mobile bg

Prokaryotic RNA Sequencing

Transcriptome-wide profiling of prokaryotic RNA to characterize gene expression, operon structure, and regulatory responses in microbial systems.
Request a Quote
(Prokaryotic RNA Sequencing)
Request a Quote
(Prokaryotic RNA Sequencing)
OverviewOverview
BenefitsBenefits
ApplicationsApplications
SpecificationsSpecifications
ResourcesResources

Prokaryotic RNA sequencing employs NGS technology to sequence the prokaryotic transcriptome, rapidly and systematically acquiring data for all coding and non-coding RNA transcripts. It profiles the transcriptome via a strand-specific RNA library for more accurate transcript expression estimation.


Novogene uses advanced Illumina NovaSeq platforms for cDNA library construction and sequencing. These platforms adopt a paired-end 150-base-pair (bp) protocol, consistently generating high-fidelity, high-quality short-read data. Backed by rich industry experience and substantial sequencing capacity, Novogene offers a comprehensive service portfolio tailored to diverse research needs.

Benefits of Novogene Prokaryotic RNA Sequencing

Extensive Expertise
Extensive Expertise

With a proven track record of delivering more than 1 million RNA-seq samples per year, Novogene is a trusted leader in genomic sequencing.

Extensive Expertise
Extensive Expertise

With a proven track record of delivering more than 1 million RNA-seq samples per year, Novogene is a trusted leader in genomic sequencing.

Tailored Solutions
Tailored Solutions

Benefit from customized workflows and specialized analyses designed to address the unique demands of complex or challenging samples.

Tailored Solutions
Tailored Solutions

Benefit from customized workflows and specialized analyses designed to address the unique demands of complex or challenging samples.

Exceptional Data Quality

Consistently outperforming industry benchmarks, Novogene ensures high-fidelity and accurate data to meet your research objectives.

Exceptional Data Quality

Consistently outperforming industry benchmarks, Novogene ensures high-fidelity and accurate data to meet your research objectives.

Benefits of Novogene Prokaryotic RNA Sequencing

Extensive Expertise
Extensive Expertise

With a proven track record of delivering more than 1 million RNA-seq samples per year, Novogene is a trusted leader in genomic sequencing.

Extensive Expertise
Extensive Expertise

With a proven track record of delivering more than 1 million RNA-seq samples per year, Novogene is a trusted leader in genomic sequencing.

Tailored Solutions
Tailored Solutions

Benefit from customized workflows and specialized analyses designed to address the unique demands of complex or challenging samples.

Tailored Solutions
Tailored Solutions

Benefit from customized workflows and specialized analyses designed to address the unique demands of complex or challenging samples.

Exceptional Data Quality

Consistently outperforming industry benchmarks, Novogene ensures high-fidelity and accurate data to meet your research objectives.

Exceptional Data Quality

Consistently outperforming industry benchmarks, Novogene ensures high-fidelity and accurate data to meet your research objectives.

Applications of Prokaryotic RNA Sequencing

Prokaryotic RNA-seq provides a comprehensive view of gene expression and regulatory architecture in bacteria and archaea, supporting studies in microbial physiology, pathogenesis, and stress adaptation.

Environmental-Impact Analysis

Explore how environmental changes influence microbial biological functions and ecological roles.

Environmental-Impact Analysis

Explore how environmental changes influence microbial biological functions and ecological roles.

Stress-Response Mechanisms

Investigate microorganism physiological adaptations under various stress conditions to uncover survival strategies.

Stress-Response Mechanisms

Investigate microorganism physiological adaptations under various stress conditions to uncover survival strategies.

Trait-Differentiation Studies

Pinpoint key functional genes responsible for phenotypic variations or differential traits triggered by specific treatments.

Trait-Differentiation Studies

Pinpoint key functional genes responsible for phenotypic variations or differential traits triggered by specific treatments.

Applications of Prokaryotic RNA Sequencing

Prokaryotic RNA-seq provides a comprehensive view of gene expression and regulatory architecture in bacteria and archaea, supporting studies in microbial physiology, pathogenesis, and stress adaptation.

Environmental-Impact Analysis

Explore how environmental changes influence microbial biological functions and ecological roles.

Environmental-Impact Analysis

Explore how environmental changes influence microbial biological functions and ecological roles.

Stress-Response Mechanisms

Investigate microorganism physiological adaptations under various stress conditions to uncover survival strategies.

Stress-Response Mechanisms

Investigate microorganism physiological adaptations under various stress conditions to uncover survival strategies.

Trait-Differentiation Studies

Pinpoint key functional genes responsible for phenotypic variations or differential traits triggered by specific treatments.

Trait-Differentiation Studies

Pinpoint key functional genes responsible for phenotypic variations or differential traits triggered by specific treatments.

Specifications

Sample Requirements

Sample amounts are listed for reference only. Download the Sample Requirements to learn more. For detailed information, please contact us with your customized requests.

Library TypeSample TypeAmountRNA Integrity NumberPurity
Prokaryotic RNA LibraryTotal RNA≥ 500 ng≥ 6.0, smooth base lineA260/280 ≥ 2.0;
A260/230 ≥ 2.0;
no degradation, no contamination

Sample Requirements

Sample amounts are listed for reference only. Download the Sample Requirements to learn more. For detailed information, please contact us with your customized requests.

Library TypeSample TypeAmountRNA Integrity NumberPurity
Prokaryotic RNA LibraryTotal RNA≥ 500 ng≥ 6.0, smooth base lineA260/280 ≥ 2.0;
A260/230 ≥ 2.0;
no degradation, no contamination

Sample Requirements

Sample amounts are listed for reference only. Download the Sample Requirements to learn more. For detailed information, please contact us with your customized requests.

Library TypeSample TypeAmountRNA Integrity NumberPurity
Prokaryotic RNA LibraryTotal RNA≥ 500 ng≥ 6.0, smooth base lineA260/280 ≥ 2.0;
A260/230 ≥ 2.0;
no degradation, no contamination

Sample Requirements

Sample amounts are listed for reference only. Download the Sample Requirements to learn more. For detailed information, please contact us with your customized requests.

Library TypeSample TypeAmountRNA Integrity NumberPurity
Prokaryotic RNA LibraryTotal RNA≥ 500 ng≥ 6.0, smooth base lineA260/280 ≥ 2.0;
A260/230 ≥ 2.0;
no degradation, no contamination

Sequencing and Analysis

Recommended data outputs and analysis contents displayed are for reference only. For detailed information, please contact us with your customized requests.

Sequencing PlatformIllumina NovaSeq System
Read LengthPaired-end 150bp
Recommended Data Amount≥ 2Gb raw data per sample for the species with reference genome
Content of Data Analysis• Data Quality Control
• Alignment to Reference Genome
• Gene Expression Analysis
• Novel Transcript Prediction
• Gene expression quantification & differential expression analysis
• Enrichment Analysis
• Operon, Promoter and TSS/TTS Prediction
• SD Sequence Prediction
• Rho-independent Terminator Sequence Prediction
• sRNA Secondary Structure Prediction
• sRNA Targeted Gene Prediction

Project Workflow

Our Prokaryotic RNA-seq workflow ensures high-quality results through a rigorous, step-by-step process:

Project Workflow

Sequencing and Analysis

Recommended data outputs and analysis contents displayed are for reference only. For detailed information, please contact us with your customized requests.

Sequencing PlatformIllumina NovaSeq System
Read LengthPaired-end 150bp
Recommended Data Amount≥ 2Gb raw data per sample for the species with reference genome
Content of Data Analysis• Data Quality Control
• Alignment to Reference Genome
• Gene Expression Analysis
• Novel Transcript Prediction
• Gene expression quantification & differential expression analysis
• Enrichment Analysis
• Operon, Promoter and TSS/TTS Prediction
• SD Sequence Prediction
• Rho-independent Terminator Sequence Prediction
• sRNA Secondary Structure Prediction
• sRNA Targeted Gene Prediction

Project Workflow

Our Prokaryotic RNA-seq workflow ensures high-quality results through a rigorous, step-by-step process:

Project Workflow

Sequencing and Analysis

Recommended data outputs and analysis contents displayed are for reference only. For detailed information, please contact us with your customized requests.

Sequencing PlatformIllumina NovaSeq System
Read LengthPaired-end 150bp
Recommended Data Amount≥ 2Gb raw data per sample for the species with reference genome
Content of Data Analysis• Data Quality Control
• Alignment to Reference Genome
• Gene Expression Analysis
• Novel Transcript Prediction
• Gene expression quantification & differential expression analysis
• Enrichment Analysis
• Operon, Promoter and TSS/TTS Prediction
• SD Sequence Prediction
• Rho-independent Terminator Sequence Prediction
• sRNA Secondary Structure Prediction
• sRNA Targeted Gene Prediction

Project Workflow

Our Prokaryotic RNA-seq workflow ensures high-quality results through a rigorous, step-by-step process:

Project Workflow

Sequencing and Analysis

Recommended data outputs and analysis contents displayed are for reference only. For detailed information, please contact us with your customized requests.

Sequencing PlatformIllumina NovaSeq System
Read LengthPaired-end 150bp
Recommended Data Amount≥ 2Gb raw data per sample for the species with reference genome
Content of Data Analysis• Data Quality Control
• Alignment to Reference Genome
• Gene Expression Analysis
• Novel Transcript Prediction
• Gene expression quantification & differential expression analysis
• Enrichment Analysis
• Operon, Promoter and TSS/TTS Prediction
• SD Sequence Prediction
• Rho-independent Terminator Sequence Prediction
• sRNA Secondary Structure Prediction
• sRNA Targeted Gene Prediction

Project Workflow

Our Prokaryotic RNA-seq workflow ensures high-quality results through a rigorous, step-by-step process:

Project Workflow

Specifications

Sample Requirements

Sample amounts are listed for reference only. Download the Sample Requirements to learn more. For detailed information, please contact us with your customized requests.

Library TypeSample TypeAmountRNA Integrity NumberPurity
Prokaryotic RNA LibraryTotal RNA≥ 500 ng≥ 6.0, smooth base lineA260/280 ≥ 2.0;
A260/230 ≥ 2.0;
no degradation, no contamination

Sample Requirements

Sample amounts are listed for reference only. Download the Sample Requirements to learn more. For detailed information, please contact us with your customized requests.

Library TypeSample TypeAmountRNA Integrity NumberPurity
Prokaryotic RNA LibraryTotal RNA≥ 500 ng≥ 6.0, smooth base lineA260/280 ≥ 2.0;
A260/230 ≥ 2.0;
no degradation, no contamination

Sample Requirements

Sample amounts are listed for reference only. Download the Sample Requirements to learn more. For detailed information, please contact us with your customized requests.

Library TypeSample TypeAmountRNA Integrity NumberPurity
Prokaryotic RNA LibraryTotal RNA≥ 500 ng≥ 6.0, smooth base lineA260/280 ≥ 2.0;
A260/230 ≥ 2.0;
no degradation, no contamination

Sample Requirements

Sample amounts are listed for reference only. Download the Sample Requirements to learn more. For detailed information, please contact us with your customized requests.

Library TypeSample TypeAmountRNA Integrity NumberPurity
Prokaryotic RNA LibraryTotal RNA≥ 500 ng≥ 6.0, smooth base lineA260/280 ≥ 2.0;
A260/230 ≥ 2.0;
no degradation, no contamination

Sequencing and Analysis

Recommended data outputs and analysis contents displayed are for reference only. For detailed information, please contact us with your customized requests.

Sequencing PlatformIllumina NovaSeq System
Read LengthPaired-end 150bp
Recommended Data Amount≥ 2Gb raw data per sample for the species with reference genome
Content of Data Analysis• Data Quality Control
• Alignment to Reference Genome
• Gene Expression Analysis
• Novel Transcript Prediction
• Gene expression quantification & differential expression analysis
• Enrichment Analysis
• Operon, Promoter and TSS/TTS Prediction
• SD Sequence Prediction
• Rho-independent Terminator Sequence Prediction
• sRNA Secondary Structure Prediction
• sRNA Targeted Gene Prediction

Project Workflow

Our Prokaryotic RNA-seq workflow ensures high-quality results through a rigorous, step-by-step process:

Project Workflow

Sequencing and Analysis

Recommended data outputs and analysis contents displayed are for reference only. For detailed information, please contact us with your customized requests.

Sequencing PlatformIllumina NovaSeq System
Read LengthPaired-end 150bp
Recommended Data Amount≥ 2Gb raw data per sample for the species with reference genome
Content of Data Analysis• Data Quality Control
• Alignment to Reference Genome
• Gene Expression Analysis
• Novel Transcript Prediction
• Gene expression quantification & differential expression analysis
• Enrichment Analysis
• Operon, Promoter and TSS/TTS Prediction
• SD Sequence Prediction
• Rho-independent Terminator Sequence Prediction
• sRNA Secondary Structure Prediction
• sRNA Targeted Gene Prediction

Project Workflow

Our Prokaryotic RNA-seq workflow ensures high-quality results through a rigorous, step-by-step process:

Project Workflow

Sequencing and Analysis

Recommended data outputs and analysis contents displayed are for reference only. For detailed information, please contact us with your customized requests.

Sequencing PlatformIllumina NovaSeq System
Read LengthPaired-end 150bp
Recommended Data Amount≥ 2Gb raw data per sample for the species with reference genome
Content of Data Analysis• Data Quality Control
• Alignment to Reference Genome
• Gene Expression Analysis
• Novel Transcript Prediction
• Gene expression quantification & differential expression analysis
• Enrichment Analysis
• Operon, Promoter and TSS/TTS Prediction
• SD Sequence Prediction
• Rho-independent Terminator Sequence Prediction
• sRNA Secondary Structure Prediction
• sRNA Targeted Gene Prediction

Project Workflow

Our Prokaryotic RNA-seq workflow ensures high-quality results through a rigorous, step-by-step process:

Project Workflow

Sequencing and Analysis

Recommended data outputs and analysis contents displayed are for reference only. For detailed information, please contact us with your customized requests.

Sequencing PlatformIllumina NovaSeq System
Read LengthPaired-end 150bp
Recommended Data Amount≥ 2Gb raw data per sample for the species with reference genome
Content of Data Analysis• Data Quality Control
• Alignment to Reference Genome
• Gene Expression Analysis
• Novel Transcript Prediction
• Gene expression quantification & differential expression analysis
• Enrichment Analysis
• Operon, Promoter and TSS/TTS Prediction
• SD Sequence Prediction
• Rho-independent Terminator Sequence Prediction
• sRNA Secondary Structure Prediction
• sRNA Targeted Gene Prediction

Project Workflow

Our Prokaryotic RNA-seq workflow ensures high-quality results through a rigorous, step-by-step process:

Project Workflow

Demo Results

Image
Image
1/1
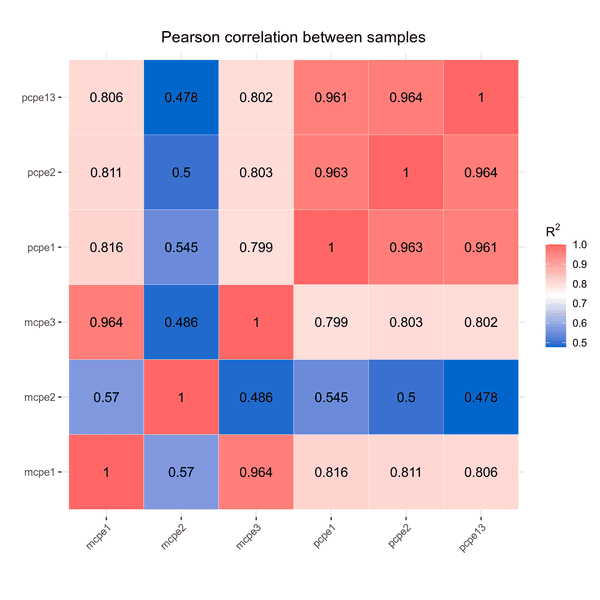
Inter-sample Correlation Heatmap

Inter-sample correlation heatmap visually displays the similarity of expression profiles or data patterns between different samples via color intensity, helping assess data reproducibility and sample grouping consistency.

Image
Image
1/1
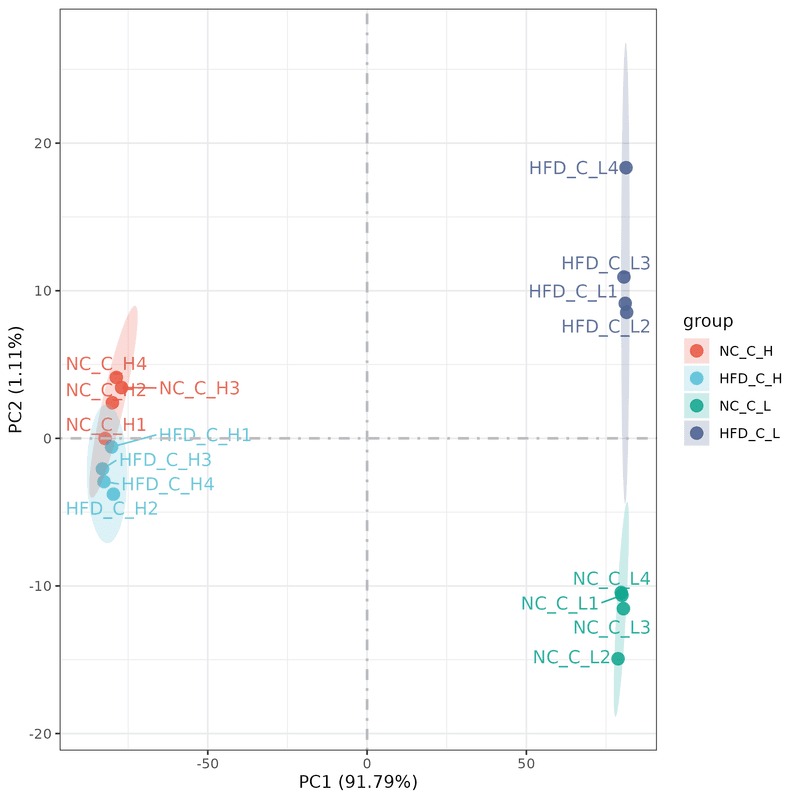
Principal Component Analysis (PCA) Plot

Principal component analysis (PCA) result visually reduces high-dimensional data complexity, revealing overall patterns, sample clustering, and potential outliers to assess data quality and biological variability.

Image
Image
1/1
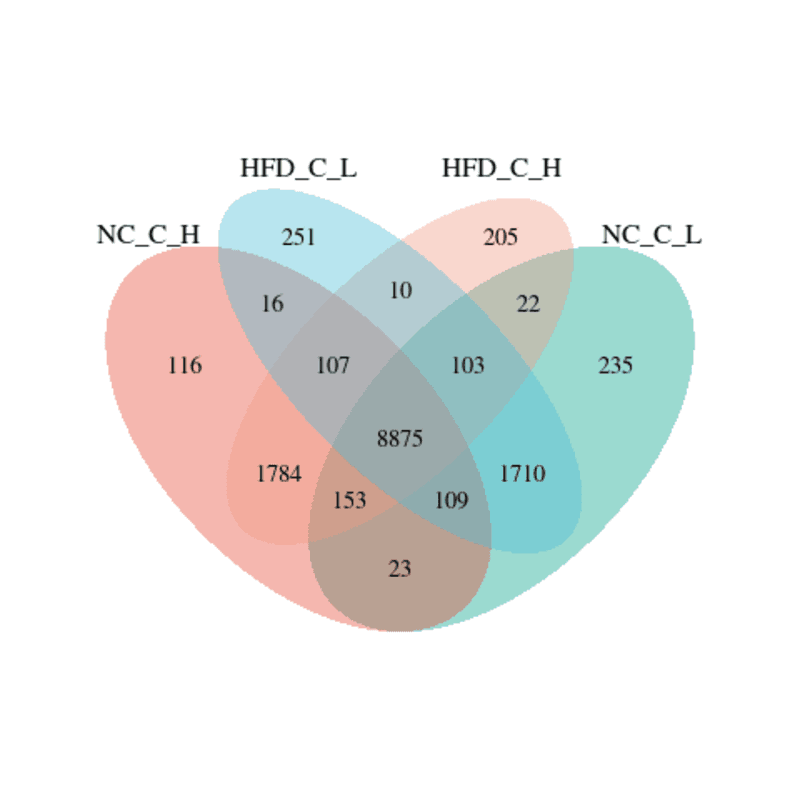
Co-expression Venn Diagram

The Co-expression Venn diagram intuitively identifies common and unique coexpressed gene sets across multiple experimental groups, facilitating the discovery of shared or specific coexpression patterns.

Image
Image
1/1
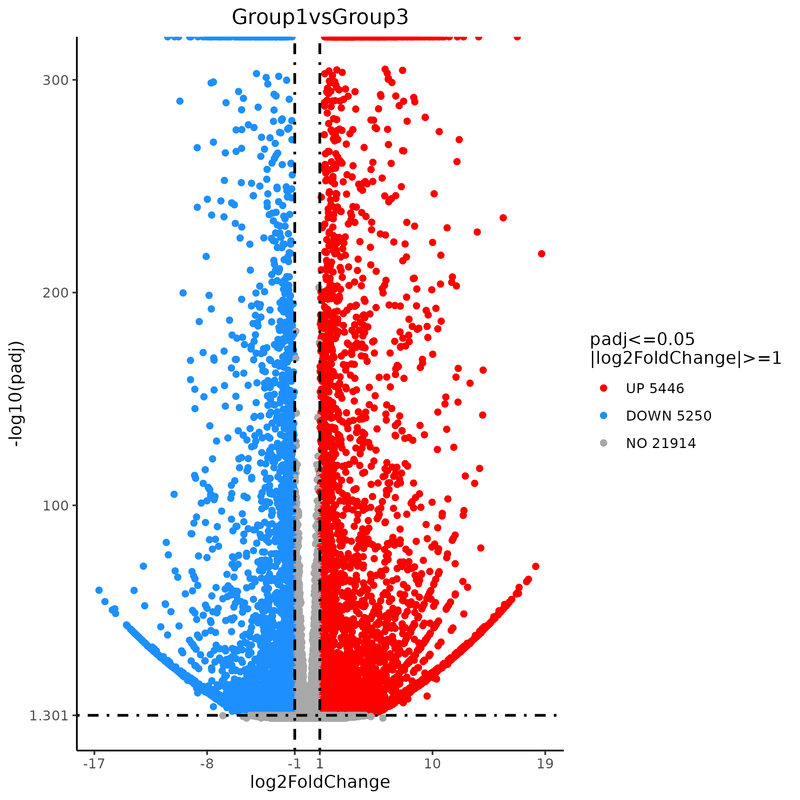
Differentially Expressed Gene Volcano Plot

The Differentially expressed gene volcano plot intuitively visualizes the magnitude of expression changes (fold change) and statistical significance (p-value) of differential genes, enabling rapid identification of significantly upregulated or downregulated genes.

Image
Image
1/1
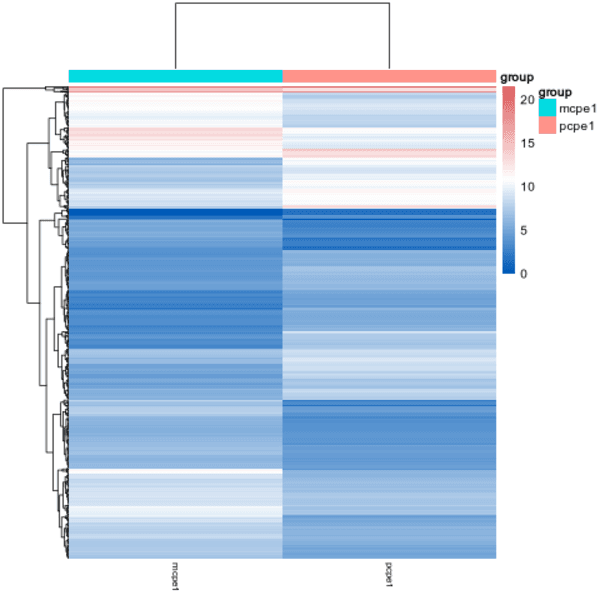
Differentially Expressed Gene Clustering Heatmap

This heatmap clusters differentially expressed genes by their expression patterns, visually highlighting similarities/differences in gene expression across samples to facilitate the identification of functionally related gene groups.

Image
Image
1/1
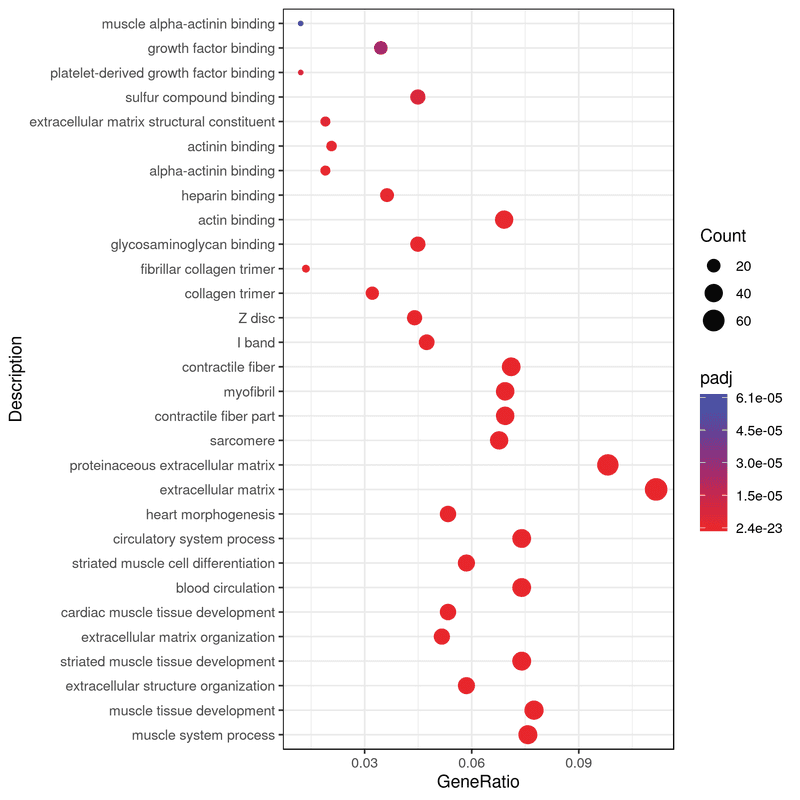
Enrichment Analysis Scatter Plot

This scatter plot visualizes enrichment analysis results by mapping enriched terms (e.g., pathways/GO terms) against metrics like enrichment score and significance, enabling intuitive identification of key functional categories associated with target genes.

Image
Image
1/1
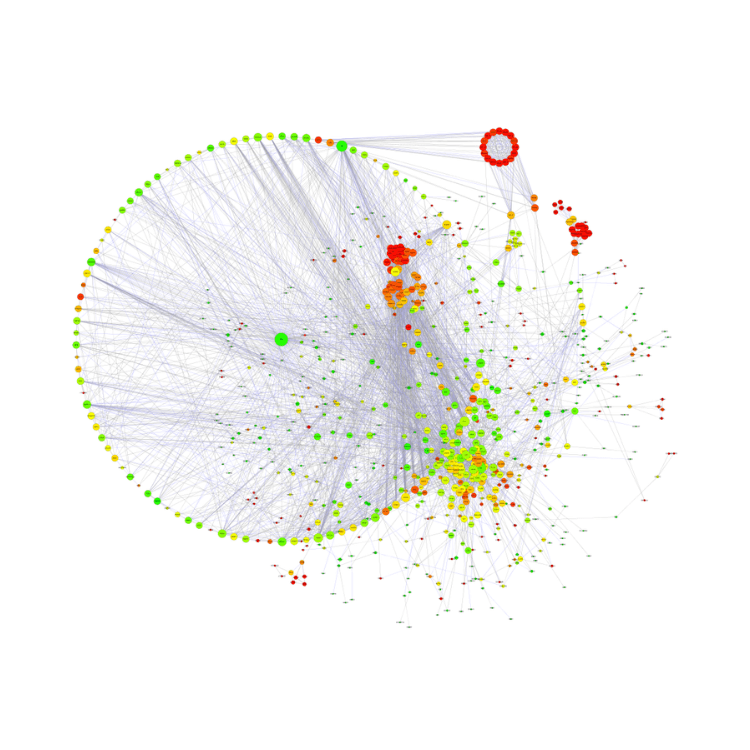
Protein–protein Interaction Network

This analysis constructs and dissects networks of physical/functional interactions between proteins to reveal core functional modules, key hub proteins, and potential molecular mechanisms underlying biological processes or diseases.

Image
Image
1/1
Inter-sample Correlation Heatmap

Inter-sample correlation heatmap visually displays the similarity of expression profiles or data patterns between different samples via color intensity, helping assess data reproducibility and sample grouping consistency.

Image
Image
1/1
Principal Component Analysis (PCA) Plot

Principal component analysis (PCA) result visually reduces high-dimensional data complexity, revealing overall patterns, sample clustering, and potential outliers to assess data quality and biological variability.

Image
Image
1/1
Co-expression Venn Diagram

The Co-expression Venn diagram intuitively identifies common and unique coexpressed gene sets across multiple experimental groups, facilitating the discovery of shared or specific coexpression patterns.

Image
Image
1/1
Differentially Expressed Gene Volcano Plot

The Differentially expressed gene volcano plot intuitively visualizes the magnitude of expression changes (fold change) and statistical significance (p-value) of differential genes, enabling rapid identification of significantly upregulated or downregulated genes.

Image
Image
1/1
Differentially Expressed Gene Clustering Heatmap

This heatmap clusters differentially expressed genes by their expression patterns, visually highlighting similarities/differences in gene expression across samples to facilitate the identification of functionally related gene groups.

Image
Image
1/1
Enrichment Analysis Scatter Plot

This scatter plot visualizes enrichment analysis results by mapping enriched terms (e.g., pathways/GO terms) against metrics like enrichment score and significance, enabling intuitive identification of key functional categories associated with target genes.

Image
Image
1/1
Protein–protein Interaction Network

This analysis constructs and dissects networks of physical/functional interactions between proteins to reveal core functional modules, key hub proteins, and potential molecular mechanisms underlying biological processes or diseases.

Demo Results

Image
Image
1/1
Inter-sample Correlation Heatmap

Inter-sample correlation heatmap visually displays the similarity of expression profiles or data patterns between different samples via color intensity, helping assess data reproducibility and sample grouping consistency.

Image
Image
1/1
Principal Component Analysis (PCA) Plot

Principal component analysis (PCA) result visually reduces high-dimensional data complexity, revealing overall patterns, sample clustering, and potential outliers to assess data quality and biological variability.

Image
Image
1/1
Co-expression Venn Diagram

The Co-expression Venn diagram intuitively identifies common and unique coexpressed gene sets across multiple experimental groups, facilitating the discovery of shared or specific coexpression patterns.

Image
Image
1/1
Differentially Expressed Gene Volcano Plot

The Differentially expressed gene volcano plot intuitively visualizes the magnitude of expression changes (fold change) and statistical significance (p-value) of differential genes, enabling rapid identification of significantly upregulated or downregulated genes.

Image
Image
1/1
Differentially Expressed Gene Clustering Heatmap

This heatmap clusters differentially expressed genes by their expression patterns, visually highlighting similarities/differences in gene expression across samples to facilitate the identification of functionally related gene groups.

Image
Image
1/1
Enrichment Analysis Scatter Plot

This scatter plot visualizes enrichment analysis results by mapping enriched terms (e.g., pathways/GO terms) against metrics like enrichment score and significance, enabling intuitive identification of key functional categories associated with target genes.

Image
Image
1/1
Protein–protein Interaction Network

This analysis constructs and dissects networks of physical/functional interactions between proteins to reveal core functional modules, key hub proteins, and potential molecular mechanisms underlying biological processes or diseases.

Image
Image
1/1
Inter-sample Correlation Heatmap

Inter-sample correlation heatmap visually displays the similarity of expression profiles or data patterns between different samples via color intensity, helping assess data reproducibility and sample grouping consistency.

Image
Image
1/1
Principal Component Analysis (PCA) Plot

Principal component analysis (PCA) result visually reduces high-dimensional data complexity, revealing overall patterns, sample clustering, and potential outliers to assess data quality and biological variability.

Image
Image
1/1
Co-expression Venn Diagram

The Co-expression Venn diagram intuitively identifies common and unique coexpressed gene sets across multiple experimental groups, facilitating the discovery of shared or specific coexpression patterns.

Image
Image
1/1
Differentially Expressed Gene Volcano Plot

The Differentially expressed gene volcano plot intuitively visualizes the magnitude of expression changes (fold change) and statistical significance (p-value) of differential genes, enabling rapid identification of significantly upregulated or downregulated genes.

Image
Image
1/1
Differentially Expressed Gene Clustering Heatmap

This heatmap clusters differentially expressed genes by their expression patterns, visually highlighting similarities/differences in gene expression across samples to facilitate the identification of functionally related gene groups.

Image
Image
1/1
Enrichment Analysis Scatter Plot

This scatter plot visualizes enrichment analysis results by mapping enriched terms (e.g., pathways/GO terms) against metrics like enrichment score and significance, enabling intuitive identification of key functional categories associated with target genes.

Image
Image
1/1
Protein–protein Interaction Network

This analysis constructs and dissects networks of physical/functional interactions between proteins to reveal core functional modules, key hub proteins, and potential molecular mechanisms underlying biological processes or diseases.

More Services

Microbial de novo Sequencing
(Microbial de novo Sequencing)
Microbial de novo Sequencing
(Microbial de novo Sequencing)
Microbial Whole Genome Sequencing
(Microbial Whole Genome Sequencing)
Microbial Whole Genome Sequencing
(Microbial Whole Genome Sequencing)
Metatranscriptome Sequencing
(Metatranscriptome Sequencing)
Metatranscriptome Sequencing
(Metatranscriptome Sequencing)

More Services

Microbial de novo Sequencing
(Microbial de novo Sequencing)
Microbial de novo Sequencing
(Microbial de novo Sequencing)
Microbial Whole Genome Sequencing
(Microbial Whole Genome Sequencing)
Microbial Whole Genome Sequencing
(Microbial Whole Genome Sequencing)
Metatranscriptome Sequencing
(Metatranscriptome Sequencing)
Metatranscriptome Sequencing
(Metatranscriptome Sequencing)
Background
Background

Ready to Start Your Project?

Our platform offers tailored solutions for

your unique experimental needs, ensuring a seamless experience from project design to data delivery.


Privacy PolicyCookie PolicyCareers
banner laptop bg
banner mobile bg

Prokaryotic RNA Sequencing

Transcriptome-wide profiling of prokaryotic RNA to characterize gene expression, operon structure, and regulatory responses in microbial systems.
Request a Quote
(Prokaryotic RNA Sequencing)
Request a Quote
(Prokaryotic RNA Sequencing)
OverviewOverview
BenefitsBenefits
ApplicationsApplications
SpecificationsSpecifications
ResourcesResources

Prokaryotic RNA sequencing employs NGS technology to sequence the prokaryotic transcriptome, rapidly and systematically acquiring data for all coding and non-coding RNA transcripts. It profiles the transcriptome via a strand-specific RNA library for more accurate transcript expression estimation.


Novogene uses advanced Illumina NovaSeq platforms for cDNA library construction and sequencing. These platforms adopt a paired-end 150-base-pair (bp) protocol, consistently generating high-fidelity, high-quality short-read data. Backed by rich industry experience and substantial sequencing capacity, Novogene offers a comprehensive service portfolio tailored to diverse research needs.

Benefits of Novogene Prokaryotic RNA Sequencing

Extensive Expertise
Extensive Expertise

With a proven track record of delivering more than 1 million RNA-seq samples per year, Novogene is a trusted leader in genomic sequencing.

Extensive Expertise
Extensive Expertise

With a proven track record of delivering more than 1 million RNA-seq samples per year, Novogene is a trusted leader in genomic sequencing.

Tailored Solutions
Tailored Solutions

Benefit from customized workflows and specialized analyses designed to address the unique demands of complex or challenging samples.

Tailored Solutions
Tailored Solutions

Benefit from customized workflows and specialized analyses designed to address the unique demands of complex or challenging samples.

Exceptional Data Quality

Consistently outperforming industry benchmarks, Novogene ensures high-fidelity and accurate data to meet your research objectives.

Exceptional Data Quality

Consistently outperforming industry benchmarks, Novogene ensures high-fidelity and accurate data to meet your research objectives.

Benefits of Novogene Prokaryotic RNA Sequencing

Extensive Expertise
Extensive Expertise

With a proven track record of delivering more than 1 million RNA-seq samples per year, Novogene is a trusted leader in genomic sequencing.

Extensive Expertise
Extensive Expertise

With a proven track record of delivering more than 1 million RNA-seq samples per year, Novogene is a trusted leader in genomic sequencing.

Tailored Solutions
Tailored Solutions

Benefit from customized workflows and specialized analyses designed to address the unique demands of complex or challenging samples.

Tailored Solutions
Tailored Solutions

Benefit from customized workflows and specialized analyses designed to address the unique demands of complex or challenging samples.

Exceptional Data Quality

Consistently outperforming industry benchmarks, Novogene ensures high-fidelity and accurate data to meet your research objectives.

Exceptional Data Quality

Consistently outperforming industry benchmarks, Novogene ensures high-fidelity and accurate data to meet your research objectives.

Applications of Prokaryotic RNA Sequencing

Prokaryotic RNA-seq provides a comprehensive view of gene expression and regulatory architecture in bacteria and archaea, supporting studies in microbial physiology, pathogenesis, and stress adaptation.

Environmental-Impact Analysis

Explore how environmental changes influence microbial biological functions and ecological roles.

Environmental-Impact Analysis

Explore how environmental changes influence microbial biological functions and ecological roles.

Stress-Response Mechanisms

Investigate microorganism physiological adaptations under various stress conditions to uncover survival strategies.

Stress-Response Mechanisms

Investigate microorganism physiological adaptations under various stress conditions to uncover survival strategies.

Trait-Differentiation Studies

Pinpoint key functional genes responsible for phenotypic variations or differential traits triggered by specific treatments.

Trait-Differentiation Studies

Pinpoint key functional genes responsible for phenotypic variations or differential traits triggered by specific treatments.

Applications of Prokaryotic RNA Sequencing

Prokaryotic RNA-seq provides a comprehensive view of gene expression and regulatory architecture in bacteria and archaea, supporting studies in microbial physiology, pathogenesis, and stress adaptation.

Environmental-Impact Analysis

Explore how environmental changes influence microbial biological functions and ecological roles.

Environmental-Impact Analysis

Explore how environmental changes influence microbial biological functions and ecological roles.

Stress-Response Mechanisms

Investigate microorganism physiological adaptations under various stress conditions to uncover survival strategies.

Stress-Response Mechanisms

Investigate microorganism physiological adaptations under various stress conditions to uncover survival strategies.

Trait-Differentiation Studies

Pinpoint key functional genes responsible for phenotypic variations or differential traits triggered by specific treatments.

Trait-Differentiation Studies

Pinpoint key functional genes responsible for phenotypic variations or differential traits triggered by specific treatments.

Specifications

Sample Requirements

Sample amounts are listed for reference only. Download the Sample Requirements to learn more. For detailed information, please contact us with your customized requests.

Library TypeSample TypeAmountRNA Integrity NumberPurity
Prokaryotic RNA LibraryTotal RNA≥ 500 ng≥ 6.0, smooth base lineA260/280 ≥ 2.0;
A260/230 ≥ 2.0;
no degradation, no contamination

Sample Requirements

Sample amounts are listed for reference only. Download the Sample Requirements to learn more. For detailed information, please contact us with your customized requests.

Library TypeSample TypeAmountRNA Integrity NumberPurity
Prokaryotic RNA LibraryTotal RNA≥ 500 ng≥ 6.0, smooth base lineA260/280 ≥ 2.0;
A260/230 ≥ 2.0;
no degradation, no contamination

Sample Requirements

Sample amounts are listed for reference only. Download the Sample Requirements to learn more. For detailed information, please contact us with your customized requests.

Library TypeSample TypeAmountRNA Integrity NumberPurity
Prokaryotic RNA LibraryTotal RNA≥ 500 ng≥ 6.0, smooth base lineA260/280 ≥ 2.0;
A260/230 ≥ 2.0;
no degradation, no contamination

Sample Requirements

Sample amounts are listed for reference only. Download the Sample Requirements to learn more. For detailed information, please contact us with your customized requests.

Library TypeSample TypeAmountRNA Integrity NumberPurity
Prokaryotic RNA LibraryTotal RNA≥ 500 ng≥ 6.0, smooth base lineA260/280 ≥ 2.0;
A260/230 ≥ 2.0;
no degradation, no contamination

Sequencing and Analysis

Recommended data outputs and analysis contents displayed are for reference only. For detailed information, please contact us with your customized requests.

Sequencing PlatformIllumina NovaSeq System
Read LengthPaired-end 150bp
Recommended Data Amount≥ 2Gb raw data per sample for the species with reference genome
Content of Data Analysis• Data Quality Control
• Alignment to Reference Genome
• Gene Expression Analysis
• Novel Transcript Prediction
• Gene expression quantification & differential expression analysis
• Enrichment Analysis
• Operon, Promoter and TSS/TTS Prediction
• SD Sequence Prediction
• Rho-independent Terminator Sequence Prediction
• sRNA Secondary Structure Prediction
• sRNA Targeted Gene Prediction

Project Workflow

Our Prokaryotic RNA-seq workflow ensures high-quality results through a rigorous, step-by-step process:

Project Workflow

Sequencing and Analysis

Recommended data outputs and analysis contents displayed are for reference only. For detailed information, please contact us with your customized requests.

Sequencing PlatformIllumina NovaSeq System
Read LengthPaired-end 150bp
Recommended Data Amount≥ 2Gb raw data per sample for the species with reference genome
Content of Data Analysis• Data Quality Control
• Alignment to Reference Genome
• Gene Expression Analysis
• Novel Transcript Prediction
• Gene expression quantification & differential expression analysis
• Enrichment Analysis
• Operon, Promoter and TSS/TTS Prediction
• SD Sequence Prediction
• Rho-independent Terminator Sequence Prediction
• sRNA Secondary Structure Prediction
• sRNA Targeted Gene Prediction

Project Workflow

Our Prokaryotic RNA-seq workflow ensures high-quality results through a rigorous, step-by-step process:

Project Workflow

Sequencing and Analysis

Recommended data outputs and analysis contents displayed are for reference only. For detailed information, please contact us with your customized requests.

Sequencing PlatformIllumina NovaSeq System
Read LengthPaired-end 150bp
Recommended Data Amount≥ 2Gb raw data per sample for the species with reference genome
Content of Data Analysis• Data Quality Control
• Alignment to Reference Genome
• Gene Expression Analysis
• Novel Transcript Prediction
• Gene expression quantification & differential expression analysis
• Enrichment Analysis
• Operon, Promoter and TSS/TTS Prediction
• SD Sequence Prediction
• Rho-independent Terminator Sequence Prediction
• sRNA Secondary Structure Prediction
• sRNA Targeted Gene Prediction

Project Workflow

Our Prokaryotic RNA-seq workflow ensures high-quality results through a rigorous, step-by-step process:

Project Workflow

Sequencing and Analysis

Recommended data outputs and analysis contents displayed are for reference only. For detailed information, please contact us with your customized requests.

Sequencing PlatformIllumina NovaSeq System
Read LengthPaired-end 150bp
Recommended Data Amount≥ 2Gb raw data per sample for the species with reference genome
Content of Data Analysis• Data Quality Control
• Alignment to Reference Genome
• Gene Expression Analysis
• Novel Transcript Prediction
• Gene expression quantification & differential expression analysis
• Enrichment Analysis
• Operon, Promoter and TSS/TTS Prediction
• SD Sequence Prediction
• Rho-independent Terminator Sequence Prediction
• sRNA Secondary Structure Prediction
• sRNA Targeted Gene Prediction

Project Workflow

Our Prokaryotic RNA-seq workflow ensures high-quality results through a rigorous, step-by-step process:

Project Workflow

Specifications

Sample Requirements

Sample amounts are listed for reference only. Download the Sample Requirements to learn more. For detailed information, please contact us with your customized requests.

Library TypeSample TypeAmountRNA Integrity NumberPurity
Prokaryotic RNA LibraryTotal RNA≥ 500 ng≥ 6.0, smooth base lineA260/280 ≥ 2.0;
A260/230 ≥ 2.0;
no degradation, no contamination

Sample Requirements

Sample amounts are listed for reference only. Download the Sample Requirements to learn more. For detailed information, please contact us with your customized requests.

Library TypeSample TypeAmountRNA Integrity NumberPurity
Prokaryotic RNA LibraryTotal RNA≥ 500 ng≥ 6.0, smooth base lineA260/280 ≥ 2.0;
A260/230 ≥ 2.0;
no degradation, no contamination

Sample Requirements

Sample amounts are listed for reference only. Download the Sample Requirements to learn more. For detailed information, please contact us with your customized requests.

Library TypeSample TypeAmountRNA Integrity NumberPurity
Prokaryotic RNA LibraryTotal RNA≥ 500 ng≥ 6.0, smooth base lineA260/280 ≥ 2.0;
A260/230 ≥ 2.0;
no degradation, no contamination

Sample Requirements

Sample amounts are listed for reference only. Download the Sample Requirements to learn more. For detailed information, please contact us with your customized requests.

Library TypeSample TypeAmountRNA Integrity NumberPurity
Prokaryotic RNA LibraryTotal RNA≥ 500 ng≥ 6.0, smooth base lineA260/280 ≥ 2.0;
A260/230 ≥ 2.0;
no degradation, no contamination

Sequencing and Analysis

Recommended data outputs and analysis contents displayed are for reference only. For detailed information, please contact us with your customized requests.

Sequencing PlatformIllumina NovaSeq System
Read LengthPaired-end 150bp
Recommended Data Amount≥ 2Gb raw data per sample for the species with reference genome
Content of Data Analysis• Data Quality Control
• Alignment to Reference Genome
• Gene Expression Analysis
• Novel Transcript Prediction
• Gene expression quantification & differential expression analysis
• Enrichment Analysis
• Operon, Promoter and TSS/TTS Prediction
• SD Sequence Prediction
• Rho-independent Terminator Sequence Prediction
• sRNA Secondary Structure Prediction
• sRNA Targeted Gene Prediction

Project Workflow

Our Prokaryotic RNA-seq workflow ensures high-quality results through a rigorous, step-by-step process:

Project Workflow

Sequencing and Analysis

Recommended data outputs and analysis contents displayed are for reference only. For detailed information, please contact us with your customized requests.

Sequencing PlatformIllumina NovaSeq System
Read LengthPaired-end 150bp
Recommended Data Amount≥ 2Gb raw data per sample for the species with reference genome
Content of Data Analysis• Data Quality Control
• Alignment to Reference Genome
• Gene Expression Analysis
• Novel Transcript Prediction
• Gene expression quantification & differential expression analysis
• Enrichment Analysis
• Operon, Promoter and TSS/TTS Prediction
• SD Sequence Prediction
• Rho-independent Terminator Sequence Prediction
• sRNA Secondary Structure Prediction
• sRNA Targeted Gene Prediction

Project Workflow

Our Prokaryotic RNA-seq workflow ensures high-quality results through a rigorous, step-by-step process:

Project Workflow

Sequencing and Analysis

Recommended data outputs and analysis contents displayed are for reference only. For detailed information, please contact us with your customized requests.

Sequencing PlatformIllumina NovaSeq System
Read LengthPaired-end 150bp
Recommended Data Amount≥ 2Gb raw data per sample for the species with reference genome
Content of Data Analysis• Data Quality Control
• Alignment to Reference Genome
• Gene Expression Analysis
• Novel Transcript Prediction
• Gene expression quantification & differential expression analysis
• Enrichment Analysis
• Operon, Promoter and TSS/TTS Prediction
• SD Sequence Prediction
• Rho-independent Terminator Sequence Prediction
• sRNA Secondary Structure Prediction
• sRNA Targeted Gene Prediction

Project Workflow

Our Prokaryotic RNA-seq workflow ensures high-quality results through a rigorous, step-by-step process:

Project Workflow

Sequencing and Analysis

Recommended data outputs and analysis contents displayed are for reference only. For detailed information, please contact us with your customized requests.

Sequencing PlatformIllumina NovaSeq System
Read LengthPaired-end 150bp
Recommended Data Amount≥ 2Gb raw data per sample for the species with reference genome
Content of Data Analysis• Data Quality Control
• Alignment to Reference Genome
• Gene Expression Analysis
• Novel Transcript Prediction
• Gene expression quantification & differential expression analysis
• Enrichment Analysis
• Operon, Promoter and TSS/TTS Prediction
• SD Sequence Prediction
• Rho-independent Terminator Sequence Prediction
• sRNA Secondary Structure Prediction
• sRNA Targeted Gene Prediction

Project Workflow

Our Prokaryotic RNA-seq workflow ensures high-quality results through a rigorous, step-by-step process:

Project Workflow

Demo Results

Image
Image
1/1
Inter-sample Correlation Heatmap

Inter-sample correlation heatmap visually displays the similarity of expression profiles or data patterns between different samples via color intensity, helping assess data reproducibility and sample grouping consistency.

Image
Image
1/1
Principal Component Analysis (PCA) Plot

Principal component analysis (PCA) result visually reduces high-dimensional data complexity, revealing overall patterns, sample clustering, and potential outliers to assess data quality and biological variability.

Image
Image
1/1
Co-expression Venn Diagram

The Co-expression Venn diagram intuitively identifies common and unique coexpressed gene sets across multiple experimental groups, facilitating the discovery of shared or specific coexpression patterns.

Image
Image
1/1
Differentially Expressed Gene Volcano Plot

The Differentially expressed gene volcano plot intuitively visualizes the magnitude of expression changes (fold change) and statistical significance (p-value) of differential genes, enabling rapid identification of significantly upregulated or downregulated genes.

Image
Image
1/1
Differentially Expressed Gene Clustering Heatmap

This heatmap clusters differentially expressed genes by their expression patterns, visually highlighting similarities/differences in gene expression across samples to facilitate the identification of functionally related gene groups.

Image
Image
1/1
Enrichment Analysis Scatter Plot

This scatter plot visualizes enrichment analysis results by mapping enriched terms (e.g., pathways/GO terms) against metrics like enrichment score and significance, enabling intuitive identification of key functional categories associated with target genes.

Image
Image
1/1
Protein–protein Interaction Network

This analysis constructs and dissects networks of physical/functional interactions between proteins to reveal core functional modules, key hub proteins, and potential molecular mechanisms underlying biological processes or diseases.

Image
Image
1/1
Inter-sample Correlation Heatmap

Inter-sample correlation heatmap visually displays the similarity of expression profiles or data patterns between different samples via color intensity, helping assess data reproducibility and sample grouping consistency.

Image
Image
1/1
Principal Component Analysis (PCA) Plot

Principal component analysis (PCA) result visually reduces high-dimensional data complexity, revealing overall patterns, sample clustering, and potential outliers to assess data quality and biological variability.

Image
Image
1/1
Co-expression Venn Diagram

The Co-expression Venn diagram intuitively identifies common and unique coexpressed gene sets across multiple experimental groups, facilitating the discovery of shared or specific coexpression patterns.

Image
Image
1/1
Differentially Expressed Gene Volcano Plot

The Differentially expressed gene volcano plot intuitively visualizes the magnitude of expression changes (fold change) and statistical significance (p-value) of differential genes, enabling rapid identification of significantly upregulated or downregulated genes.

Image
Image
1/1
Differentially Expressed Gene Clustering Heatmap

This heatmap clusters differentially expressed genes by their expression patterns, visually highlighting similarities/differences in gene expression across samples to facilitate the identification of functionally related gene groups.

Image
Image
1/1
Enrichment Analysis Scatter Plot

This scatter plot visualizes enrichment analysis results by mapping enriched terms (e.g., pathways/GO terms) against metrics like enrichment score and significance, enabling intuitive identification of key functional categories associated with target genes.

Image
Image
1/1
Protein–protein Interaction Network

This analysis constructs and dissects networks of physical/functional interactions between proteins to reveal core functional modules, key hub proteins, and potential molecular mechanisms underlying biological processes or diseases.

Demo Results

Image
Image
1/1
Inter-sample Correlation Heatmap

Inter-sample correlation heatmap visually displays the similarity of expression profiles or data patterns between different samples via color intensity, helping assess data reproducibility and sample grouping consistency.

Image
Image
1/1
Principal Component Analysis (PCA) Plot

Principal component analysis (PCA) result visually reduces high-dimensional data complexity, revealing overall patterns, sample clustering, and potential outliers to assess data quality and biological variability.

Image
Image
1/1
Co-expression Venn Diagram

The Co-expression Venn diagram intuitively identifies common and unique coexpressed gene sets across multiple experimental groups, facilitating the discovery of shared or specific coexpression patterns.

Image
Image
1/1
Differentially Expressed Gene Volcano Plot

The Differentially expressed gene volcano plot intuitively visualizes the magnitude of expression changes (fold change) and statistical significance (p-value) of differential genes, enabling rapid identification of significantly upregulated or downregulated genes.

Image
Image
1/1
Differentially Expressed Gene Clustering Heatmap

This heatmap clusters differentially expressed genes by their expression patterns, visually highlighting similarities/differences in gene expression across samples to facilitate the identification of functionally related gene groups.

Image
Image
1/1
Enrichment Analysis Scatter Plot

This scatter plot visualizes enrichment analysis results by mapping enriched terms (e.g., pathways/GO terms) against metrics like enrichment score and significance, enabling intuitive identification of key functional categories associated with target genes.

Image
Image
1/1
Protein–protein Interaction Network

This analysis constructs and dissects networks of physical/functional interactions between proteins to reveal core functional modules, key hub proteins, and potential molecular mechanisms underlying biological processes or diseases.

Image
Image
1/1
Inter-sample Correlation Heatmap

Inter-sample correlation heatmap visually displays the similarity of expression profiles or data patterns between different samples via color intensity, helping assess data reproducibility and sample grouping consistency.

Image
Image
1/1
Principal Component Analysis (PCA) Plot

Principal component analysis (PCA) result visually reduces high-dimensional data complexity, revealing overall patterns, sample clustering, and potential outliers to assess data quality and biological variability.

Image
Image
1/1
Co-expression Venn Diagram

The Co-expression Venn diagram intuitively identifies common and unique coexpressed gene sets across multiple experimental groups, facilitating the discovery of shared or specific coexpression patterns.

Image
Image
1/1
Differentially Expressed Gene Volcano Plot

The Differentially expressed gene volcano plot intuitively visualizes the magnitude of expression changes (fold change) and statistical significance (p-value) of differential genes, enabling rapid identification of significantly upregulated or downregulated genes.

Image
Image
1/1
Differentially Expressed Gene Clustering Heatmap

This heatmap clusters differentially expressed genes by their expression patterns, visually highlighting similarities/differences in gene expression across samples to facilitate the identification of functionally related gene groups.

Image
Image
1/1
Enrichment Analysis Scatter Plot

This scatter plot visualizes enrichment analysis results by mapping enriched terms (e.g., pathways/GO terms) against metrics like enrichment score and significance, enabling intuitive identification of key functional categories associated with target genes.

Image
Image
1/1
Protein–protein Interaction Network

This analysis constructs and dissects networks of physical/functional interactions between proteins to reveal core functional modules, key hub proteins, and potential molecular mechanisms underlying biological processes or diseases.

More Services

Microbial de novo Sequencing
(Microbial de novo Sequencing)
Microbial de novo Sequencing
(Microbial de novo Sequencing)
Microbial Whole Genome Sequencing
(Microbial Whole Genome Sequencing)
Microbial Whole Genome Sequencing
(Microbial Whole Genome Sequencing)
Metatranscriptome Sequencing
(Metatranscriptome Sequencing)
Metatranscriptome Sequencing
(Metatranscriptome Sequencing)

More Services

Microbial de novo Sequencing
(Microbial de novo Sequencing)
Microbial de novo Sequencing
(Microbial de novo Sequencing)
Microbial Whole Genome Sequencing
(Microbial Whole Genome Sequencing)
Microbial Whole Genome Sequencing
(Microbial Whole Genome Sequencing)
Metatranscriptome Sequencing
(Metatranscriptome Sequencing)
Metatranscriptome Sequencing
(Metatranscriptome Sequencing)
Background
Background

Ready to Start Your Project?

Our platform offers tailored solutions for

your unique experimental needs, ensuring a seamless experience from project design to data delivery.


Privacy PolicyCookie PolicyCareers