
Novogene AMEA
  • Novogene AMEA
  • Genomics
    • Human Whole Genome Sequencing
    • Plant and Animal Whole Genome Sequencing
    • Microbial Whole Genome Sequencing
    • Plant and Animal De novo Sequencing
    • Microbial De novo Sequencing
    • Shotgun Metagenomics Sequencing
    • Amplicon Sequencing
    • Whole Exome Sequencing
    Transcriptomics
    • mRNA Sequencing
    • Total RNA Sequencing
    • Full-Length Transcriptome Sequencing
    • Whole Transcriptome Sequencing
    • Small RNA Sequencing
    • Circular RNA Sequencing
    • Metatranscriptome Sequencing
    • Prokaryotic RNA Sequencing
    Single Cell & Spatial Omics
    • Single Cell Gene Expression
    • Single Cell Immune Profiling Sequencing
    • Single Cell Long Read Transcriptome
    • Visium HD Spatial Gene Expression
    • Stereo-Seq Spatial Gene Expression
    • Xenium In Situ Spatial Transcriptome
    Epigenomics
    • Whole Genome Bisulfite Sequencing (WGBS)
    • Directed DNA Methylation Sequencing (DM-Seq) NEW
    • Reduced Representation Bisulfite Sequencing (RRBS)
    • Chromatin Immunoprecipitation Sequencing (ChIP-seq)
    • RNA Immunoprecipitation Sequencing (RIP-seq)
    • Assay for Transposase-Accessible Chromatin with Sequencing (ATAC-seq)

    Premade Library

    • Sequencing Only on Illumina Sequencer
    • Sequencing Only on PacBio Sequencer
    Proteomics and Metabolomics
    • Olink Proteomics
    • Quantitative Proteomics
    • Untargeted Metabolomics
  • PromotionsPromotions
    • Platforms
    • Automated Delivery Platform (Falcon)
    • Bioinformatics Analysis Tool (NovoMagic)
    • Customer Service System (CSS)
    • Brochures
    • Case Studies
    • Webinar
    • Blog
    • Sample Guidelines
    • Cancer Research
    • Immuno-oncology
    • Agrigenomics
    • Environment
    • Food Science
    • Human Microbiome
    • Plant and Animal Microbiome
    • Drug Discovery and Development
    • Rare and Complex Diseases
    • About Us
    • Our Locations
    • News
    • Careers
  • Contact UsContact Us

ServicesServices menu

SupportSupport menu

CompanyCompany menu

Services
Whole Genome SequencingDe novo SequencingAmplicon SequencingShotgun Metagenomic SequencingDirected DNA Methylation Sequencing (DM-Seq)mRNA SequencingSingle Cell Gene ExpressionVisium HD Spatial Gene ExpressionXenium In Situ Spatial TranscriptomeOlink ProteomicsUntargeted Metabolomics
Support
NovoMagic Bioinformatics Analysis ToolCustomer Service SystemFalcon Intelligent Delivery Platform
Company
About UsOur LocationsOur PlatformsNewsCareersContact Us
LinkedInLinkedIn hoverYouTubeYouTube hoverXX hover
Copyright © 2026 Novogene Inc. All rights reserved.For Research Use Only. Not for Clinical Diagnostic Use.
Novogene AMEA
  • Novogene AMEA
  • Genomics
    • Human Whole Genome Sequencing
    • Plant and Animal Whole Genome Sequencing
    • Microbial Whole Genome Sequencing
    • Plant and Animal De novo Sequencing
    • Microbial De novo Sequencing
    • Shotgun Metagenomics Sequencing
    • Amplicon Sequencing
    • Whole Exome Sequencing
    Transcriptomics
    • mRNA Sequencing
    • Total RNA Sequencing
    • Full-Length Transcriptome Sequencing
    • Whole Transcriptome Sequencing
    • Small RNA Sequencing
    • Circular RNA Sequencing
    • Metatranscriptome Sequencing
    • Prokaryotic RNA Sequencing
    Single Cell & Spatial Omics
    • Single Cell Gene Expression
    • Single Cell Immune Profiling Sequencing
    • Single Cell Long Read Transcriptome
    • Visium HD Spatial Gene Expression
    • Stereo-Seq Spatial Gene Expression
    • Xenium In Situ Spatial Transcriptome
    Epigenomics
    • Whole Genome Bisulfite Sequencing (WGBS)
    • Directed DNA Methylation Sequencing (DM-Seq) NEW
    • Reduced Representation Bisulfite Sequencing (RRBS)
    • Chromatin Immunoprecipitation Sequencing (ChIP-seq)
    • RNA Immunoprecipitation Sequencing (RIP-seq)
    • Assay for Transposase-Accessible Chromatin with Sequencing (ATAC-seq)

    Premade Library

    • Sequencing Only on Illumina Sequencer
    • Sequencing Only on PacBio Sequencer
    Proteomics and Metabolomics
    • Olink Proteomics
    • Quantitative Proteomics
    • Untargeted Metabolomics
  • PromotionsPromotions
    • Platforms
    • Automated Delivery Platform (Falcon)
    • Bioinformatics Analysis Tool (NovoMagic)
    • Customer Service System (CSS)
    • Brochures
    • Case Studies
    • Webinar
    • Blog
    • Sample Guidelines
    • Cancer Research
    • Immuno-oncology
    • Agrigenomics
    • Environment
    • Food Science
    • Human Microbiome
    • Plant and Animal Microbiome
    • Drug Discovery and Development
    • Rare and Complex Diseases
    • About Us
    • Our Locations
    • News
    • Careers
  • Contact UsContact Us

ServicesServices menu

SupportSupport menu

CompanyCompany menu

Services
Whole Genome SequencingDe novo SequencingAmplicon SequencingShotgun Metagenomic SequencingDirected DNA Methylation Sequencing (DM-Seq)mRNA SequencingSingle Cell Gene ExpressionVisium HD Spatial Gene ExpressionXenium In Situ Spatial TranscriptomeOlink ProteomicsUntargeted Metabolomics
Support
NovoMagic Bioinformatics Analysis ToolCustomer Service SystemFalcon Intelligent Delivery Platform
Company
About UsOur LocationsOur PlatformsNewsCareersContact Us
LinkedInLinkedIn hoverYouTubeYouTube hoverXX hover
Copyright © 2026 Novogene Inc. All rights reserved.For Research Use Only. Not for Clinical Diagnostic Use.
banner laptop bg
banner mobile bg

Plant and Animal De novo Sequencing

De novo assembly of plant and animal genomes to enable accurate characterization of complex genomes and species-specific genomic features.
Request a Quote
(Plant and Animal De novo Sequencing)
Request a Quote
(Plant and Animal De novo Sequencing)
OverviewOverview
BenefitsBenefits
ApplicationsApplications
SpecificationsSpecifications
ResourcesResources

De novo sequencing involves sequencing and assembling the genome of a species without relying on a reference genome, thereby constructing a complete genomic sequence map of the species. This approach not only provides a comprehensive genomic sequence map but also lays the foundation for further research into the species' evolutionary origins and adaptations to specific environments.

With extensive experience in experimental operations and bioinformatics analyses, Novogene offers an accurate, rapid, and comprehensive characterization of species and generates reliable results. Furthermore, Novogene’s end-to-end services guarantee the ultra-fast turnaround time.

Benefits of  Novogene’s Plant and Animal De novo sequencing service

Extensive Experience

Proven expertise in assembling reference-quality genomes for diverse plant and animal species.

Extensive Experience

Proven expertise in assembling reference-quality genomes for diverse plant and animal species.

High-Quality Data
High-Quality Data

Delivering high-quality sequencing data with industry-standard performance and assembly-ready contig N50.

High-Quality Data
High-Quality Data

Delivering high-quality sequencing data with industry-standard performance and assembly-ready contig N50.

Short- and Long-Read Integration

Flexible de novo sequencing strategies combining long-read and short-read data for comprehensive genome assembly.

Short- and Long-Read Integration

Flexible de novo sequencing strategies combining long-read and short-read data for comprehensive genome assembly.

Advanced Bioinformatics Support

End-to-end assembly solutions from long-read data, with support for T2T genomes and chromosome-level assembly via Hi-C integration.

Advanced Bioinformatics Support

End-to-end assembly solutions from long-read data, with support for T2T genomes and chromosome-level assembly via Hi-C integration.

Customer Service System (CSS)

A centralized platform for project tracking, data access, and seamless collaboration throughout your sequencing workflow.

Customer Service System (CSS)

A centralized platform for project tracking, data access, and seamless collaboration throughout your sequencing workflow.

Benefits of  Novogene’s Plant and Animal De novo sequencing service

Extensive Experience

Proven expertise in assembling reference-quality genomes for diverse plant and animal species.

Extensive Experience

Proven expertise in assembling reference-quality genomes for diverse plant and animal species.

High-Quality Data
High-Quality Data

Delivering high-quality sequencing data with industry-standard performance and assembly-ready contig N50.

High-Quality Data
High-Quality Data

Delivering high-quality sequencing data with industry-standard performance and assembly-ready contig N50.

Short- and Long-Read Integration

Flexible de novo sequencing strategies combining long-read and short-read data for comprehensive genome assembly.

Short- and Long-Read Integration

Flexible de novo sequencing strategies combining long-read and short-read data for comprehensive genome assembly.

Advanced Bioinformatics Support

End-to-end assembly solutions from long-read data, with support for T2T genomes and chromosome-level assembly via Hi-C integration.

Advanced Bioinformatics Support

End-to-end assembly solutions from long-read data, with support for T2T genomes and chromosome-level assembly via Hi-C integration.

Customer Service System (CSS)

A centralized platform for project tracking, data access, and seamless collaboration throughout your sequencing workflow.

Customer Service System (CSS)

A centralized platform for project tracking, data access, and seamless collaboration throughout your sequencing workflow.

Applications of Plant and Animal De novo Sequencing

Conservation & Evolutionary Research (Animal)

Uncovers the genetic basis of environmental adaptation, traces evolutionary history, and provides critical insights for protecting endangered species.

Conservation & Evolutionary Research (Animal)

Uncovers the genetic basis of environmental adaptation, traces evolutionary history, and provides critical insights for protecting endangered species.

Agriculture & Livestock Breeding

Identifies genes associated with disease resistance, productivity, and desirable traits, enabling the development of healthier and higher-yielding breeds.

Agriculture & Livestock Breeding

Identifies genes associated with disease resistance, productivity, and desirable traits, enabling the development of healthier and higher-yielding breeds.

Biomedical Research & Drug Discovery

Facilitates the creation of better animal disease models (e.g., zebrafish) and aids drug discovery by revealing unique biological pathways from animals with special traits, such as cancer resistance.

Biomedical Research & Drug Discovery

Facilitates the creation of better animal disease models (e.g., zebrafish) and aids drug discovery by revealing unique biological pathways from animals with special traits, such as cancer resistance.

Crop Improvement & Food Security (Plant)

Provides the complete genetic blueprint to empower breeding of high-yield, nutrient-rich, and stress-resilient crop varieties, ensuring global food security.

Crop Improvement & Food Security (Plant)

Provides the complete genetic blueprint to empower breeding of high-yield, nutrient-rich, and stress-resilient crop varieties, ensuring global food security.

Evolution & Adaptation Studies (Plant)

Reveals evolutionary histories and deciphers the genetic mechanisms behind plant adaptation to environmental challenges.

Evolution & Adaptation Studies (Plant)

Reveals evolutionary histories and deciphers the genetic mechanisms behind plant adaptation to environmental challenges.

Genetic Resource Mining

Pioneers the discovery of novel genes responsible for valuable compounds and revolutionary agronomic traits, driving innovation across agriculture and biotechnology.

Genetic Resource Mining

Pioneers the discovery of novel genes responsible for valuable compounds and revolutionary agronomic traits, driving innovation across agriculture and biotechnology.

Applications of Plant and Animal De novo Sequencing

Conservation & Evolutionary Research (Animal)

Uncovers the genetic basis of environmental adaptation, traces evolutionary history, and provides critical insights for protecting endangered species.

Conservation & Evolutionary Research (Animal)

Uncovers the genetic basis of environmental adaptation, traces evolutionary history, and provides critical insights for protecting endangered species.

Agriculture & Livestock Breeding

Identifies genes associated with disease resistance, productivity, and desirable traits, enabling the development of healthier and higher-yielding breeds.

Agriculture & Livestock Breeding

Identifies genes associated with disease resistance, productivity, and desirable traits, enabling the development of healthier and higher-yielding breeds.

Biomedical Research & Drug Discovery

Facilitates the creation of better animal disease models (e.g., zebrafish) and aids drug discovery by revealing unique biological pathways from animals with special traits, such as cancer resistance.

Biomedical Research & Drug Discovery

Facilitates the creation of better animal disease models (e.g., zebrafish) and aids drug discovery by revealing unique biological pathways from animals with special traits, such as cancer resistance.

Crop Improvement & Food Security (Plant)

Provides the complete genetic blueprint to empower breeding of high-yield, nutrient-rich, and stress-resilient crop varieties, ensuring global food security.

Crop Improvement & Food Security (Plant)

Provides the complete genetic blueprint to empower breeding of high-yield, nutrient-rich, and stress-resilient crop varieties, ensuring global food security.

Evolution & Adaptation Studies (Plant)

Reveals evolutionary histories and deciphers the genetic mechanisms behind plant adaptation to environmental challenges.

Evolution & Adaptation Studies (Plant)

Reveals evolutionary histories and deciphers the genetic mechanisms behind plant adaptation to environmental challenges.

Genetic Resource Mining

Pioneers the discovery of novel genes responsible for valuable compounds and revolutionary agronomic traits, driving innovation across agriculture and biotechnology.

Genetic Resource Mining

Pioneers the discovery of novel genes responsible for valuable compounds and revolutionary agronomic traits, driving innovation across agriculture and biotechnology.

Specifications

Sample Requirements

Sample amounts are listed for reference only. Download the Sample Requirements to learn more. For detailed information, please contact us with your customized requests.

Platform TypeSample TypeAmount (Qubit®)Purity
Illumina NovaSeq SystemGenomic DNA≥ 200 ngOD260/280=1.8-2.0;
no degradation,
no contamination
PacBio Revio SystemHMW Genomic DNA≥ 3.5 μgOD260/280=1.75~2.0;
OD260/230=1.5~2.6;
*NC/QC=1.00~2.20;
Fragments should be ≥30K
Nanopore PromethIONHMW Genomic DNA≥ 8.5 μgOD260/280=1.75~2.0;
OD260/230=1.4~2.6;
*NC/QC=0.95~3.00
Fragments should be ≥30K
Nanopore PromethION
(Nanopore Ultra-long DNA Library)
uHMW Genomic DNA≥ 20 μgOD260/280=1.7-2.0;
OD260/230=1.3-2.6;
*NC/QC=0.95-3.00;
Fragments should be ≥ 100k, no fragments below 30k.
*NC/QC = NanoDrop concentration/Qubit concentration

Sample Requirements

Sample amounts are listed for reference only. Download the Sample Requirements to learn more. For detailed information, please contact us with your customized requests.

Platform TypeSample TypeAmount (Qubit®)Purity
Illumina NovaSeq SystemGenomic DNA≥ 200 ngOD260/280=1.8-2.0;
no degradation,
no contamination
PacBio Revio SystemHMW Genomic DNA≥ 3.5 μgOD260/280=1.75~2.0;
OD260/230=1.5~2.6;
*NC/QC=1.00~2.20;
Fragments should be ≥30K
Nanopore PromethIONHMW Genomic DNA≥ 8.5 μgOD260/280=1.75~2.0;
OD260/230=1.4~2.6;
*NC/QC=0.95~3.00
Fragments should be ≥30K
Nanopore PromethION
(Nanopore Ultra-long DNA Library)
uHMW Genomic DNA≥ 20 μgOD260/280=1.7-2.0;
OD260/230=1.3-2.6;
*NC/QC=0.95-3.00;
Fragments should be ≥ 100k, no fragments below 30k.
*NC/QC = NanoDrop concentration/Qubit concentration

Sample Requirements

Sample amounts are listed for reference only. Download the Sample Requirements to learn more. For detailed information, please contact us with your customized requests.

Platform TypeSample TypeAmount (Qubit®)Purity
Illumina NovaSeq SystemGenomic DNA≥ 200 ngOD260/280=1.8-2.0;
no degradation,
no contamination
PacBio Revio SystemHMW Genomic DNA≥ 3.5 μgOD260/280=1.75~2.0;
OD260/230=1.5~2.6;
*NC/QC=1.00~2.20;
Fragments should be ≥30K
Nanopore PromethIONHMW Genomic DNA≥ 8.5 μgOD260/280=1.75~2.0;
OD260/230=1.4~2.6;
*NC/QC=0.95~3.00
Fragments should be ≥30K
Nanopore PromethION
(Nanopore Ultra-long DNA Library)
uHMW Genomic DNA≥ 20 μgOD260/280=1.7-2.0;
OD260/230=1.3-2.6;
*NC/QC=0.95-3.00;
Fragments should be ≥ 100k, no fragments below 30k.
*NC/QC = NanoDrop concentration/Qubit concentration

Sample Requirements

Sample amounts are listed for reference only. Download the Sample Requirements to learn more. For detailed information, please contact us with your customized requests.

Platform TypeSample TypeAmount (Qubit®)Purity
Illumina NovaSeq SystemGenomic DNA≥ 200 ngOD260/280=1.8-2.0;
no degradation,
no contamination
PacBio Revio SystemHMW Genomic DNA≥ 3.5 μgOD260/280=1.75~2.0;
OD260/230=1.5~2.6;
*NC/QC=1.00~2.20;
Fragments should be ≥30K
Nanopore PromethIONHMW Genomic DNA≥ 8.5 μgOD260/280=1.75~2.0;
OD260/230=1.4~2.6;
*NC/QC=0.95~3.00
Fragments should be ≥30K
Nanopore PromethION
(Nanopore Ultra-long DNA Library)
uHMW Genomic DNA≥ 20 μgOD260/280=1.7-2.0;
OD260/230=1.3-2.6;
*NC/QC=0.95-3.00;
Fragments should be ≥ 100k, no fragments below 30k.
*NC/QC = NanoDrop concentration/Qubit concentration

Sequencing and Analysis

Recommended data outputs and analysis contents displayed are for reference only. For detailed information, please contact us with your customized requests.

Sequencing TypeIllumina NovaSeq SystemPacBio Revio SystemNanopore PromethION System
Read LengthPaired-end 150 bpN50>15 kbAverage > 50 kb
Recommended  Sequencing DepthFor genome survey or assembly polishing: ≥ 50×
RNA requires 4 to 6 different tissue sites.
For genome assembly: ≥ 30×
Standard AnalysisK-mer analysis
GC content analysis
Repeat content rate evaluation
Heterozygous rate evaluation
Genome size evaluation
Long-read assembly
Assembly statistics
Gene completeness evaluation
Genome Annotation-Repeat prediction
Structure prediction
Function prediction
Noncoding RNA prediction

Project Workflow

Project Workflow

Sequencing and Analysis

Recommended data outputs and analysis contents displayed are for reference only. For detailed information, please contact us with your customized requests.

Sequencing TypeIllumina NovaSeq SystemPacBio Revio SystemNanopore PromethION System
Read LengthPaired-end 150 bpN50>15 kbAverage > 50 kb
Recommended  Sequencing DepthFor genome survey or assembly polishing: ≥ 50×
RNA requires 4 to 6 different tissue sites.
For genome assembly: ≥ 30×
Standard AnalysisK-mer analysis
GC content analysis
Repeat content rate evaluation
Heterozygous rate evaluation
Genome size evaluation
Long-read assembly
Assembly statistics
Gene completeness evaluation
Genome Annotation-Repeat prediction
Structure prediction
Function prediction
Noncoding RNA prediction

Project Workflow

Project Workflow

Sequencing and Analysis

Recommended data outputs and analysis contents displayed are for reference only. For detailed information, please contact us with your customized requests.

Sequencing TypeIllumina NovaSeq SystemPacBio Revio SystemNanopore PromethION System
Read LengthPaired-end 150 bpN50>15 kbAverage > 50 kb
Recommended  Sequencing DepthFor genome survey or assembly polishing: ≥ 50×
RNA requires 4 to 6 different tissue sites.
For genome assembly: ≥ 30×
Standard AnalysisK-mer analysis
GC content analysis
Repeat content rate evaluation
Heterozygous rate evaluation
Genome size evaluation
Long-read assembly
Assembly statistics
Gene completeness evaluation
Genome Annotation-Repeat prediction
Structure prediction
Function prediction
Noncoding RNA prediction

Project Workflow

Project Workflow

Sequencing and Analysis

Recommended data outputs and analysis contents displayed are for reference only. For detailed information, please contact us with your customized requests.

Sequencing TypeIllumina NovaSeq SystemPacBio Revio SystemNanopore PromethION System
Read LengthPaired-end 150 bpN50>15 kbAverage > 50 kb
Recommended  Sequencing DepthFor genome survey or assembly polishing: ≥ 50×
RNA requires 4 to 6 different tissue sites.
For genome assembly: ≥ 30×
Standard AnalysisK-mer analysis
GC content analysis
Repeat content rate evaluation
Heterozygous rate evaluation
Genome size evaluation
Long-read assembly
Assembly statistics
Gene completeness evaluation
Genome Annotation-Repeat prediction
Structure prediction
Function prediction
Noncoding RNA prediction

Project Workflow

Project Workflow

Specifications

Sample Requirements

Sample amounts are listed for reference only. Download the Sample Requirements to learn more. For detailed information, please contact us with your customized requests.

Platform TypeSample TypeAmount (Qubit®)Purity
Illumina NovaSeq SystemGenomic DNA≥ 200 ngOD260/280=1.8-2.0;
no degradation,
no contamination
PacBio Revio SystemHMW Genomic DNA≥ 3.5 μgOD260/280=1.75~2.0;
OD260/230=1.5~2.6;
*NC/QC=1.00~2.20;
Fragments should be ≥30K
Nanopore PromethIONHMW Genomic DNA≥ 8.5 μgOD260/280=1.75~2.0;
OD260/230=1.4~2.6;
*NC/QC=0.95~3.00
Fragments should be ≥30K
Nanopore PromethION
(Nanopore Ultra-long DNA Library)
uHMW Genomic DNA≥ 20 μgOD260/280=1.7-2.0;
OD260/230=1.3-2.6;
*NC/QC=0.95-3.00;
Fragments should be ≥ 100k, no fragments below 30k.
*NC/QC = NanoDrop concentration/Qubit concentration

Sample Requirements

Sample amounts are listed for reference only. Download the Sample Requirements to learn more. For detailed information, please contact us with your customized requests.

Platform TypeSample TypeAmount (Qubit®)Purity
Illumina NovaSeq SystemGenomic DNA≥ 200 ngOD260/280=1.8-2.0;
no degradation,
no contamination
PacBio Revio SystemHMW Genomic DNA≥ 3.5 μgOD260/280=1.75~2.0;
OD260/230=1.5~2.6;
*NC/QC=1.00~2.20;
Fragments should be ≥30K
Nanopore PromethIONHMW Genomic DNA≥ 8.5 μgOD260/280=1.75~2.0;
OD260/230=1.4~2.6;
*NC/QC=0.95~3.00
Fragments should be ≥30K
Nanopore PromethION
(Nanopore Ultra-long DNA Library)
uHMW Genomic DNA≥ 20 μgOD260/280=1.7-2.0;
OD260/230=1.3-2.6;
*NC/QC=0.95-3.00;
Fragments should be ≥ 100k, no fragments below 30k.
*NC/QC = NanoDrop concentration/Qubit concentration

Sample Requirements

Sample amounts are listed for reference only. Download the Sample Requirements to learn more. For detailed information, please contact us with your customized requests.

Platform TypeSample TypeAmount (Qubit®)Purity
Illumina NovaSeq SystemGenomic DNA≥ 200 ngOD260/280=1.8-2.0;
no degradation,
no contamination
PacBio Revio SystemHMW Genomic DNA≥ 3.5 μgOD260/280=1.75~2.0;
OD260/230=1.5~2.6;
*NC/QC=1.00~2.20;
Fragments should be ≥30K
Nanopore PromethIONHMW Genomic DNA≥ 8.5 μgOD260/280=1.75~2.0;
OD260/230=1.4~2.6;
*NC/QC=0.95~3.00
Fragments should be ≥30K
Nanopore PromethION
(Nanopore Ultra-long DNA Library)
uHMW Genomic DNA≥ 20 μgOD260/280=1.7-2.0;
OD260/230=1.3-2.6;
*NC/QC=0.95-3.00;
Fragments should be ≥ 100k, no fragments below 30k.
*NC/QC = NanoDrop concentration/Qubit concentration

Sample Requirements

Sample amounts are listed for reference only. Download the Sample Requirements to learn more. For detailed information, please contact us with your customized requests.

Platform TypeSample TypeAmount (Qubit®)Purity
Illumina NovaSeq SystemGenomic DNA≥ 200 ngOD260/280=1.8-2.0;
no degradation,
no contamination
PacBio Revio SystemHMW Genomic DNA≥ 3.5 μgOD260/280=1.75~2.0;
OD260/230=1.5~2.6;
*NC/QC=1.00~2.20;
Fragments should be ≥30K
Nanopore PromethIONHMW Genomic DNA≥ 8.5 μgOD260/280=1.75~2.0;
OD260/230=1.4~2.6;
*NC/QC=0.95~3.00
Fragments should be ≥30K
Nanopore PromethION
(Nanopore Ultra-long DNA Library)
uHMW Genomic DNA≥ 20 μgOD260/280=1.7-2.0;
OD260/230=1.3-2.6;
*NC/QC=0.95-3.00;
Fragments should be ≥ 100k, no fragments below 30k.
*NC/QC = NanoDrop concentration/Qubit concentration

Sequencing and Analysis

Recommended data outputs and analysis contents displayed are for reference only. For detailed information, please contact us with your customized requests.

Sequencing TypeIllumina NovaSeq SystemPacBio Revio SystemNanopore PromethION System
Read LengthPaired-end 150 bpN50>15 kbAverage > 50 kb
Recommended  Sequencing DepthFor genome survey or assembly polishing: ≥ 50×
RNA requires 4 to 6 different tissue sites.
For genome assembly: ≥ 30×
Standard AnalysisK-mer analysis
GC content analysis
Repeat content rate evaluation
Heterozygous rate evaluation
Genome size evaluation
Long-read assembly
Assembly statistics
Gene completeness evaluation
Genome Annotation-Repeat prediction
Structure prediction
Function prediction
Noncoding RNA prediction

Project Workflow

Project Workflow

Sequencing and Analysis

Recommended data outputs and analysis contents displayed are for reference only. For detailed information, please contact us with your customized requests.

Sequencing TypeIllumina NovaSeq SystemPacBio Revio SystemNanopore PromethION System
Read LengthPaired-end 150 bpN50>15 kbAverage > 50 kb
Recommended  Sequencing DepthFor genome survey or assembly polishing: ≥ 50×
RNA requires 4 to 6 different tissue sites.
For genome assembly: ≥ 30×
Standard AnalysisK-mer analysis
GC content analysis
Repeat content rate evaluation
Heterozygous rate evaluation
Genome size evaluation
Long-read assembly
Assembly statistics
Gene completeness evaluation
Genome Annotation-Repeat prediction
Structure prediction
Function prediction
Noncoding RNA prediction

Project Workflow

Project Workflow

Sequencing and Analysis

Recommended data outputs and analysis contents displayed are for reference only. For detailed information, please contact us with your customized requests.

Sequencing TypeIllumina NovaSeq SystemPacBio Revio SystemNanopore PromethION System
Read LengthPaired-end 150 bpN50>15 kbAverage > 50 kb
Recommended  Sequencing DepthFor genome survey or assembly polishing: ≥ 50×
RNA requires 4 to 6 different tissue sites.
For genome assembly: ≥ 30×
Standard AnalysisK-mer analysis
GC content analysis
Repeat content rate evaluation
Heterozygous rate evaluation
Genome size evaluation
Long-read assembly
Assembly statistics
Gene completeness evaluation
Genome Annotation-Repeat prediction
Structure prediction
Function prediction
Noncoding RNA prediction

Project Workflow

Project Workflow

Sequencing and Analysis

Recommended data outputs and analysis contents displayed are for reference only. For detailed information, please contact us with your customized requests.

Sequencing TypeIllumina NovaSeq SystemPacBio Revio SystemNanopore PromethION System
Read LengthPaired-end 150 bpN50>15 kbAverage > 50 kb
Recommended  Sequencing DepthFor genome survey or assembly polishing: ≥ 50×
RNA requires 4 to 6 different tissue sites.
For genome assembly: ≥ 30×
Standard AnalysisK-mer analysis
GC content analysis
Repeat content rate evaluation
Heterozygous rate evaluation
Genome size evaluation
Long-read assembly
Assembly statistics
Gene completeness evaluation
Genome Annotation-Repeat prediction
Structure prediction
Function prediction
Noncoding RNA prediction

Project Workflow

Project Workflow

Demo Results

Image
Image
1/1
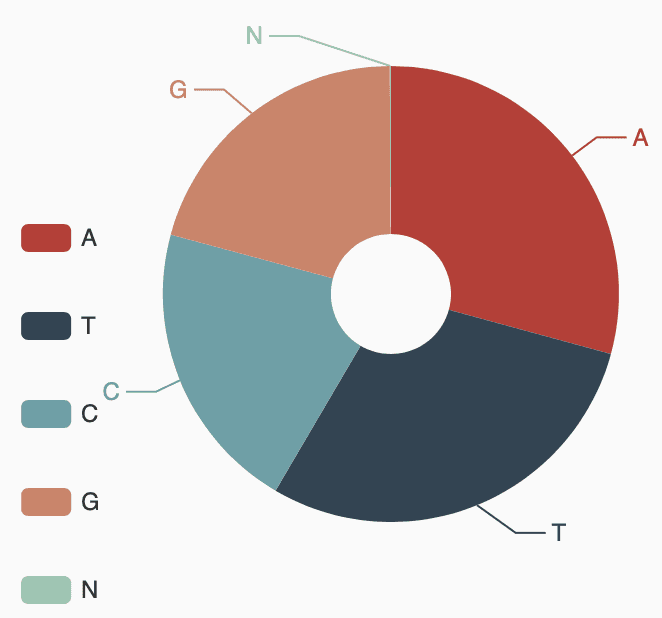
Assembly Statistics

Grain Aphid genome A/T/G/C content statistics

Image
Image
1/1
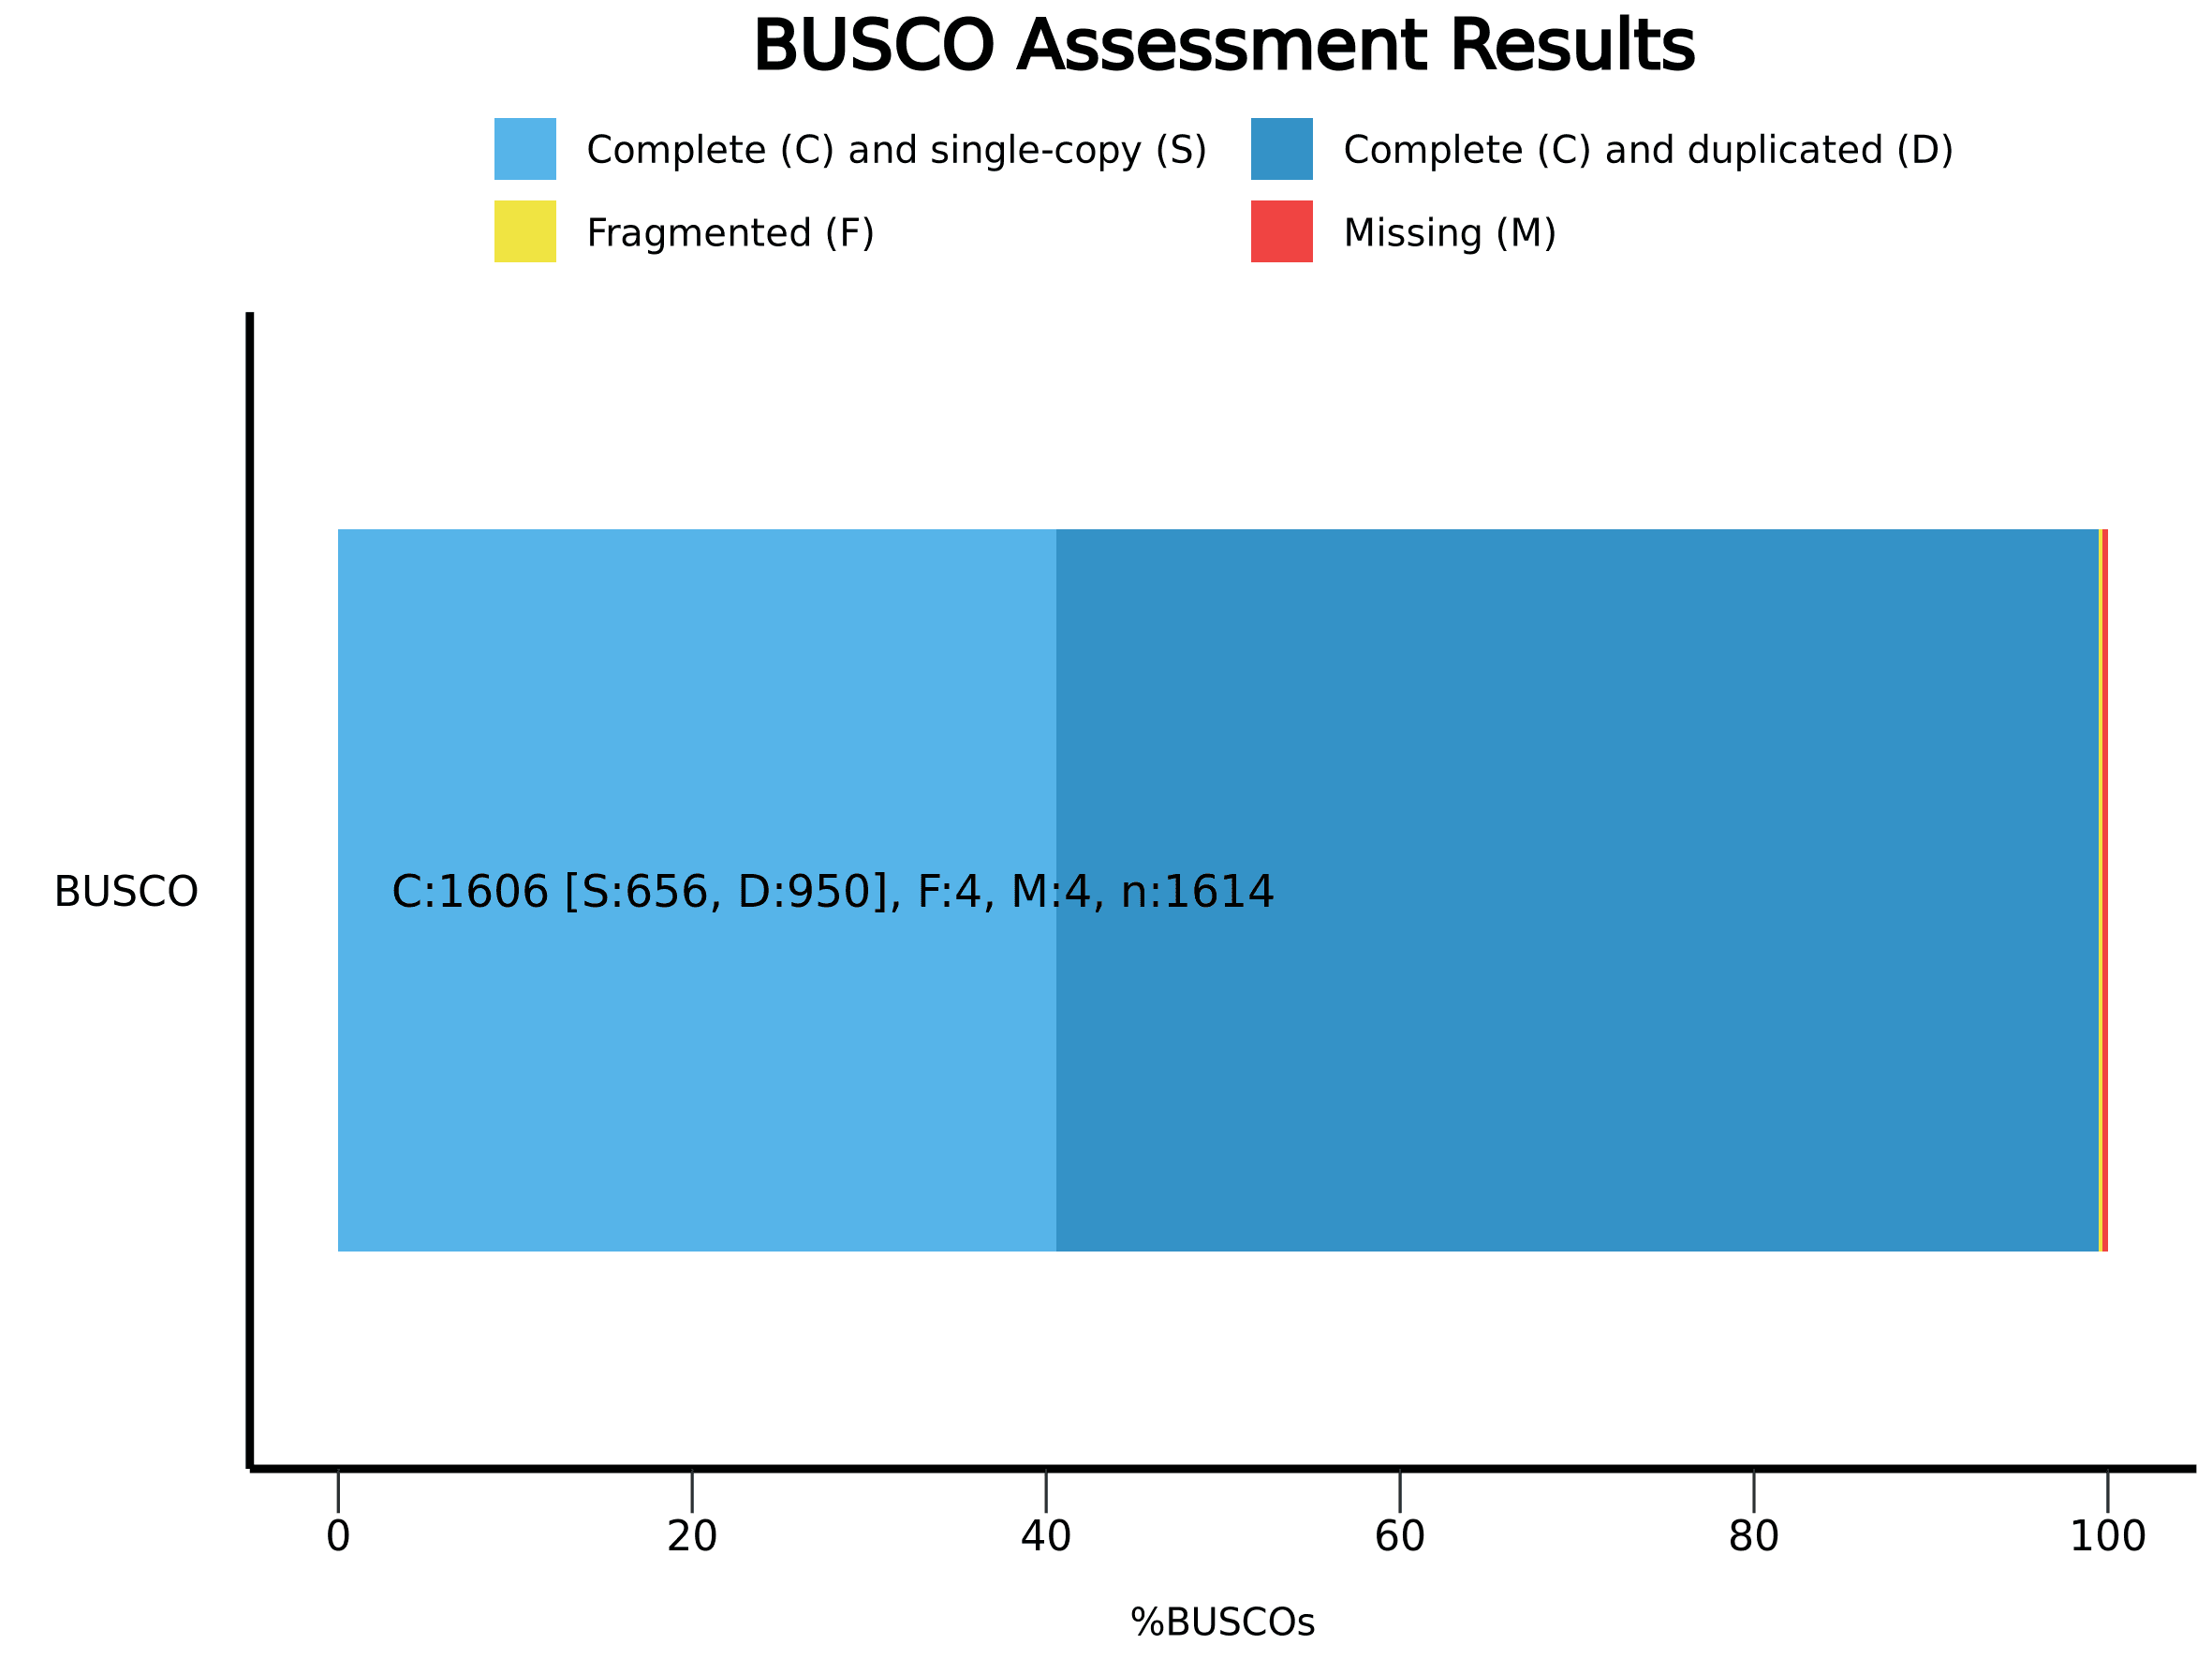
Assembly Evaluation - BUSCO Assessment

BUSCO assessment results

Note: C: Complete BUSCOs; S: Complete and single-copy BUSCOs; D: Complete Duplicated BUSCOs; F: Fragmented BUSCOs; M: Missing BUSCOs; n: Total BUSCO groups searched

Image
Image
1/1
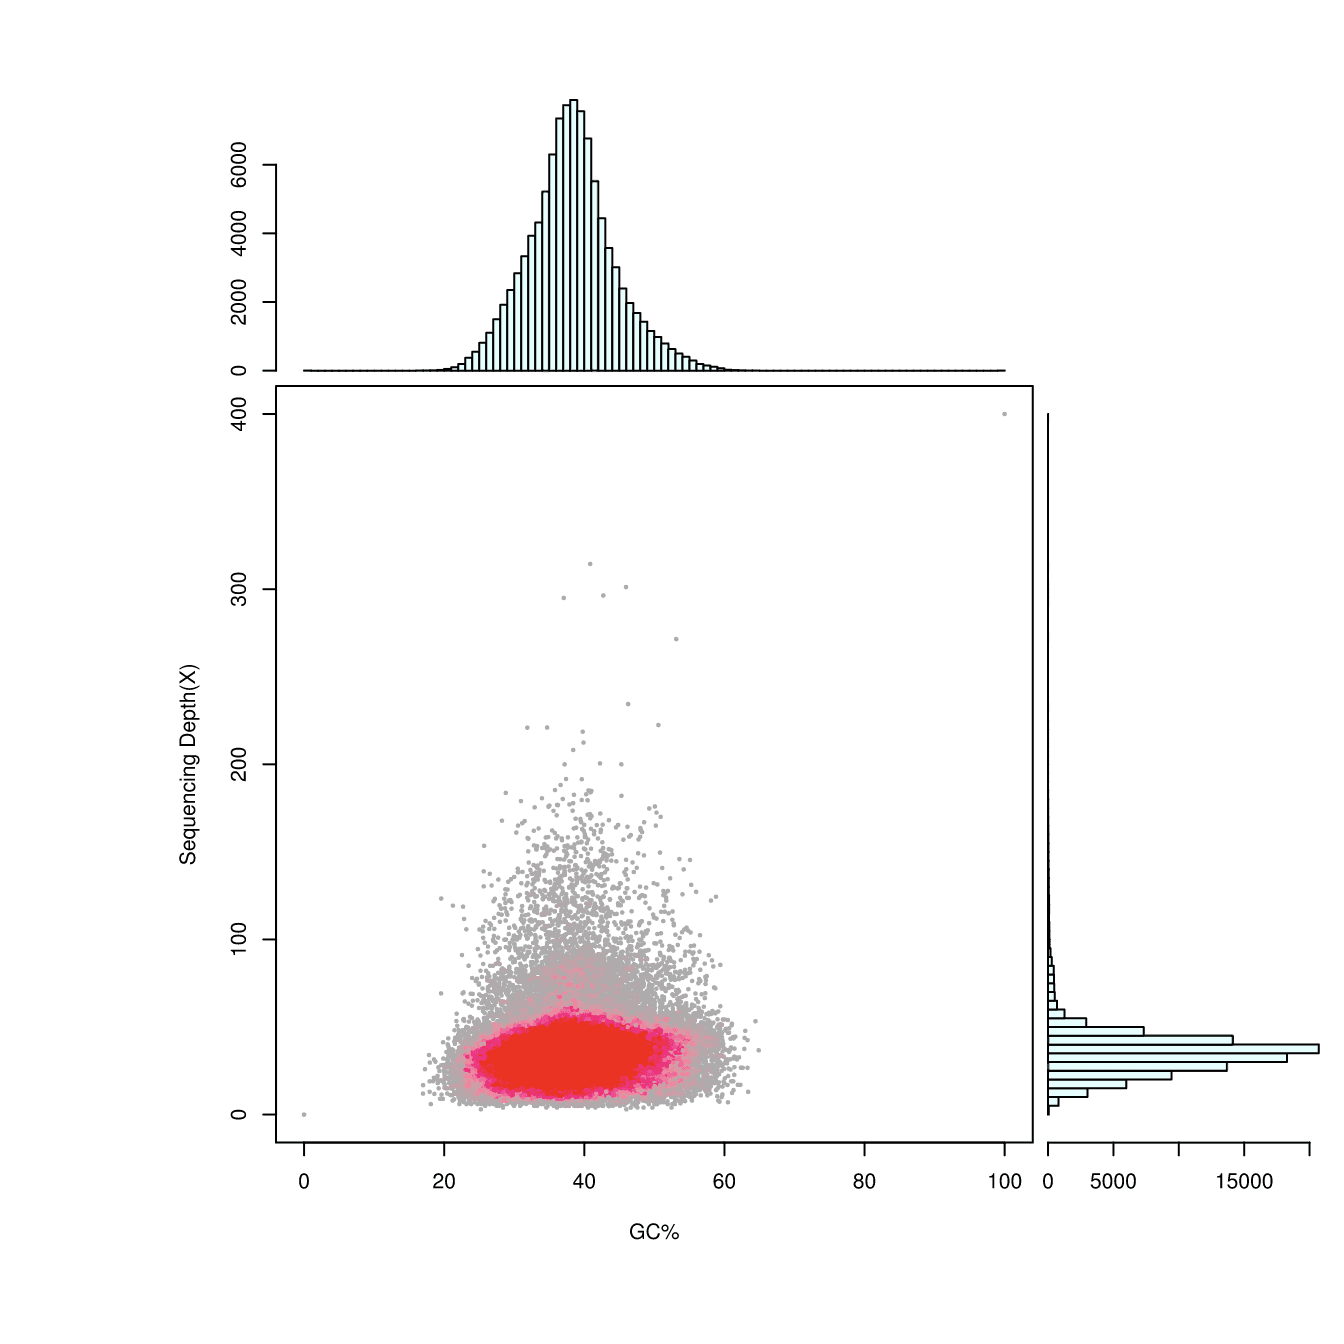
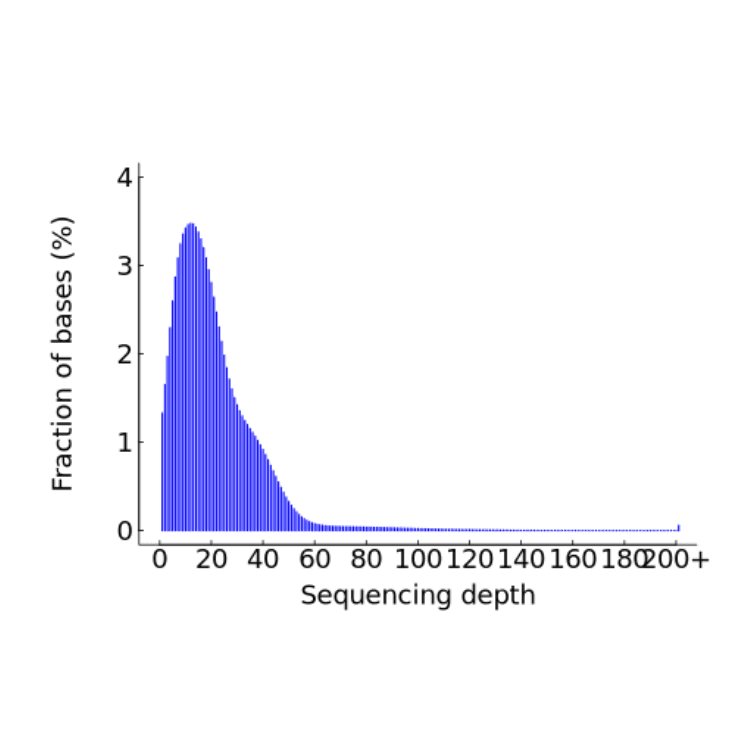
GC Content and Depth Distribution

X-axis: GC contents; y-axis: sequencing depth.

Upper: GC content distribution.

Lower right: sequencing depth distribution.

Image
Image
1/1
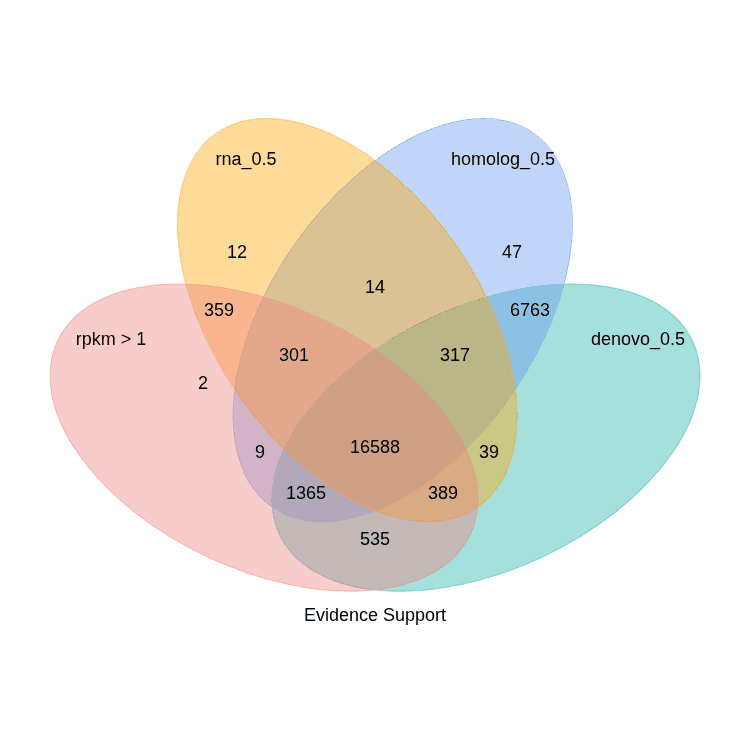
Evidence Support

Venn diagram of gene set evidence support. Augustus, GlimmerHMM, SNAP, Geneid and Genscan are used in De novo gene structure prediction.

Image
Image
1/1
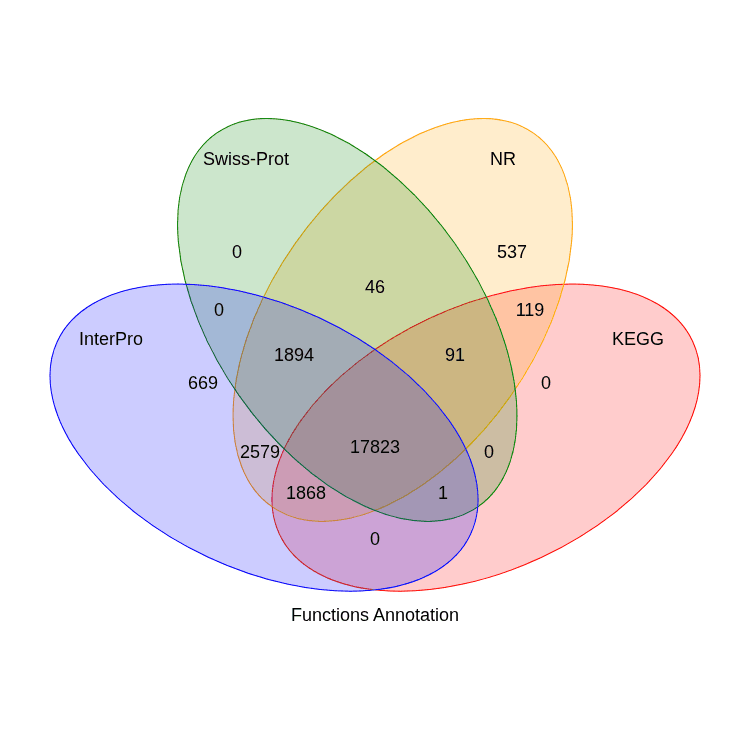
Function Prediction

Venn diagram of gene function annotationProtein sequences predicted by gene structure are aligned with known protein databases. Results suggest that the function of 95.8% of the genes could be predicted.

Image
Image
1/1
Assembly Statistics

Grain Aphid genome A/T/G/C content statistics

Image
Image
1/1
Assembly Evaluation - BUSCO Assessment

BUSCO assessment results

Note: C: Complete BUSCOs; S: Complete and single-copy BUSCOs; D: Complete Duplicated BUSCOs; F: Fragmented BUSCOs; M: Missing BUSCOs; n: Total BUSCO groups searched

Image
Image
1/1
GC Content and Depth Distribution

X-axis: GC contents; y-axis: sequencing depth.

Upper: GC content distribution.

Lower right: sequencing depth distribution.

Image
Image
1/1
Evidence Support

Venn diagram of gene set evidence support. Augustus, GlimmerHMM, SNAP, Geneid and Genscan are used in De novo gene structure prediction.

Image
Image
1/1
Function Prediction

Venn diagram of gene function annotationProtein sequences predicted by gene structure are aligned with known protein databases. Results suggest that the function of 95.8% of the genes could be predicted.

Demo Results

Image
Image
1/1
Assembly Statistics

Grain Aphid genome A/T/G/C content statistics

Image
Image
1/1
Assembly Evaluation - BUSCO Assessment

BUSCO assessment results

Note: C: Complete BUSCOs; S: Complete and single-copy BUSCOs; D: Complete Duplicated BUSCOs; F: Fragmented BUSCOs; M: Missing BUSCOs; n: Total BUSCO groups searched

Image
Image
1/1
GC Content and Depth Distribution

X-axis: GC contents; y-axis: sequencing depth.

Upper: GC content distribution.

Lower right: sequencing depth distribution.

Image
Image
1/1
Evidence Support

Venn diagram of gene set evidence support. Augustus, GlimmerHMM, SNAP, Geneid and Genscan are used in De novo gene structure prediction.

Image
Image
1/1
Function Prediction

Venn diagram of gene function annotationProtein sequences predicted by gene structure are aligned with known protein databases. Results suggest that the function of 95.8% of the genes could be predicted.

Image
Image
1/1
Assembly Statistics

Grain Aphid genome A/T/G/C content statistics

Image
Image
1/1
Assembly Evaluation - BUSCO Assessment

BUSCO assessment results

Note: C: Complete BUSCOs; S: Complete and single-copy BUSCOs; D: Complete Duplicated BUSCOs; F: Fragmented BUSCOs; M: Missing BUSCOs; n: Total BUSCO groups searched

Image
Image
1/1
GC Content and Depth Distribution

X-axis: GC contents; y-axis: sequencing depth.

Upper: GC content distribution.

Lower right: sequencing depth distribution.

Image
Image
1/1
Evidence Support

Venn diagram of gene set evidence support. Augustus, GlimmerHMM, SNAP, Geneid and Genscan are used in De novo gene structure prediction.

Image
Image
1/1
Function Prediction

Venn diagram of gene function annotationProtein sequences predicted by gene structure are aligned with known protein databases. Results suggest that the function of 95.8% of the genes could be predicted.

K-mer Analysis

Kmer=17 analyses and genome size evaluation

SampleKmerDepthn_kmerGenome_size(M)Genome_size(M)Genome_size(M)Repeat_rate(%)
plant173624,079,467,724668.87668.87668.8773
(1) K-mer: Selected K-mer length.
(2) Depth:The expected value of K-mer depth.
(3) n_K-mer:The total number of K-mer from SOAPdenovo.
(4) Genome size(M):The genome size in Mb estimated by formula: Genome Size=K-mer_num/Peak_depth.
(5) Revise Genome size(M):Revised genome size after error correction from wrong K-mer.
(6) Heteozygous ratio:The percent of heteozygous positions.
(7) Repeat:Calculated by the percentage of K-mer numbers after 1.8-fold of the main peak of total K-mer numbers.
Note: The repeat here is a mathematically repeated sequence but not a repeat element with certain biological functions.
SampleKmerDepthn_kmerGenome_size(M)Genome_size(M)Genome_size(M)Repeat_rate(%)
plant173624,079,467,724668.87668.87668.8773
(1) K-mer: Selected K-mer length.
(2) Depth:The expected value of K-mer depth.
(3) n_K-mer:The total number of K-mer from SOAPdenovo.
(4) Genome size(M):The genome size in Mb estimated by formula: Genome Size=K-mer_num/Peak_depth.
(5) Revise Genome size(M):Revised genome size after error correction from wrong K-mer.
(6) Heteozygous ratio:The percent of heteozygous positions.
(7) Repeat:Calculated by the percentage of K-mer numbers after 1.8-fold of the main peak of total K-mer numbers.
Note: The repeat here is a mathematically repeated sequence but not a repeat element with certain biological functions.
SampleKmerDepthn_kmerGenome_size(M)Genome_size(M)Genome_size(M)Repeat_rate(%)
plant173624,079,467,724668.87668.87668.8773
(1) K-mer: Selected K-mer length.
(2) Depth:The expected value of K-mer depth.
(3) n_K-mer:The total number of K-mer from SOAPdenovo.
(4) Genome size(M):The genome size in Mb estimated by formula: Genome Size=K-mer_num/Peak_depth.
(5) Revise Genome size(M):Revised genome size after error correction from wrong K-mer.
(6) Heteozygous ratio:The percent of heteozygous positions.
(7) Repeat:Calculated by the percentage of K-mer numbers after 1.8-fold of the main peak of total K-mer numbers.
Note: The repeat here is a mathematically repeated sequence but not a repeat element with certain biological functions.
SampleKmerDepthn_kmerGenome_size(M)Genome_size(M)Genome_size(M)Repeat_rate(%)
plant173624,079,467,724668.87668.87668.8773
(1) K-mer: Selected K-mer length.
(2) Depth:The expected value of K-mer depth.
(3) n_K-mer:The total number of K-mer from SOAPdenovo.
(4) Genome size(M):The genome size in Mb estimated by formula: Genome Size=K-mer_num/Peak_depth.
(5) Revise Genome size(M):Revised genome size after error correction from wrong K-mer.
(6) Heteozygous ratio:The percent of heteozygous positions.
(7) Repeat:Calculated by the percentage of K-mer numbers after 1.8-fold of the main peak of total K-mer numbers.
Note: The repeat here is a mathematically repeated sequence but not a repeat element with certain biological functions.

K-mer Analysis

Kmer=17 analyses and genome size evaluation

SampleKmerDepthn_kmerGenome_size(M)Genome_size(M)Genome_size(M)Repeat_rate(%)
plant173624,079,467,724668.87668.87668.8773
(1) K-mer: Selected K-mer length.
(2) Depth:The expected value of K-mer depth.
(3) n_K-mer:The total number of K-mer from SOAPdenovo.
(4) Genome size(M):The genome size in Mb estimated by formula: Genome Size=K-mer_num/Peak_depth.
(5) Revise Genome size(M):Revised genome size after error correction from wrong K-mer.
(6) Heteozygous ratio:The percent of heteozygous positions.
(7) Repeat:Calculated by the percentage of K-mer numbers after 1.8-fold of the main peak of total K-mer numbers.
Note: The repeat here is a mathematically repeated sequence but not a repeat element with certain biological functions.
SampleKmerDepthn_kmerGenome_size(M)Genome_size(M)Genome_size(M)Repeat_rate(%)
plant173624,079,467,724668.87668.87668.8773
(1) K-mer: Selected K-mer length.
(2) Depth:The expected value of K-mer depth.
(3) n_K-mer:The total number of K-mer from SOAPdenovo.
(4) Genome size(M):The genome size in Mb estimated by formula: Genome Size=K-mer_num/Peak_depth.
(5) Revise Genome size(M):Revised genome size after error correction from wrong K-mer.
(6) Heteozygous ratio:The percent of heteozygous positions.
(7) Repeat:Calculated by the percentage of K-mer numbers after 1.8-fold of the main peak of total K-mer numbers.
Note: The repeat here is a mathematically repeated sequence but not a repeat element with certain biological functions.
SampleKmerDepthn_kmerGenome_size(M)Genome_size(M)Genome_size(M)Repeat_rate(%)
plant173624,079,467,724668.87668.87668.8773
(1) K-mer: Selected K-mer length.
(2) Depth:The expected value of K-mer depth.
(3) n_K-mer:The total number of K-mer from SOAPdenovo.
(4) Genome size(M):The genome size in Mb estimated by formula: Genome Size=K-mer_num/Peak_depth.
(5) Revise Genome size(M):Revised genome size after error correction from wrong K-mer.
(6) Heteozygous ratio:The percent of heteozygous positions.
(7) Repeat:Calculated by the percentage of K-mer numbers after 1.8-fold of the main peak of total K-mer numbers.
Note: The repeat here is a mathematically repeated sequence but not a repeat element with certain biological functions.
SampleKmerDepthn_kmerGenome_size(M)Genome_size(M)Genome_size(M)Repeat_rate(%)
plant173624,079,467,724668.87668.87668.8773
(1) K-mer: Selected K-mer length.
(2) Depth:The expected value of K-mer depth.
(3) n_K-mer:The total number of K-mer from SOAPdenovo.
(4) Genome size(M):The genome size in Mb estimated by formula: Genome Size=K-mer_num/Peak_depth.
(5) Revise Genome size(M):Revised genome size after error correction from wrong K-mer.
(6) Heteozygous ratio:The percent of heteozygous positions.
(7) Repeat:Calculated by the percentage of K-mer numbers after 1.8-fold of the main peak of total K-mer numbers.
Note: The repeat here is a mathematically repeated sequence but not a repeat element with certain biological functions.

Frequently Asked Questions

How to Ensure the Reliability of Assembly Results? What Are the Main Methods for Evaluating Assembly Completeness and Accuracy?

In addition to ensuring Contig N50 and Scaffold N50 metrics, it is essential to evaluate the quality of the assembly. Common evaluation methods include BUSCO, LAI, Merqury, CEGMA, EST sequence assessment, RNA sequence assessment, and consensus evaluation. Among these, BUSCO assesses the genome using a library of single-copy orthologous genes, LAI evaluates genome completeness based on long terminal repeat retrotransposons, and Merqury assesses the genome's QV (Quality Value). These three evaluation methods are currently the most widely used.

What is the Recommended Strategy for De Novo Assembly?

Does Survey and Genome De Novo Require the Same DNA?

More Services

Total RNA Sequencing
(Total RNA Sequencing)
Total RNA Sequencing
(Total RNA Sequencing)
Full-Length Transcriptome Sequencin
(Full-Length Transcriptome Sequencin)
Full-Length Transcriptome Sequencin
(Full-Length Transcriptome Sequencin)
Plant and Animal Whole Genome Sequencing
(Plant and Animal Whole Genome Sequencing)
Plant and Animal Whole Genome Sequencing
(Plant and Animal Whole Genome Sequencing)

More Services

Total RNA Sequencing
(Total RNA Sequencing)
Total RNA Sequencing
(Total RNA Sequencing)
Full-Length Transcriptome Sequencin
(Full-Length Transcriptome Sequencin)
Full-Length Transcriptome Sequencin
(Full-Length Transcriptome Sequencin)
Plant and Animal Whole Genome Sequencing
(Plant and Animal Whole Genome Sequencing)
Plant and Animal Whole Genome Sequencing
(Plant and Animal Whole Genome Sequencing)
Background
Background

Ready to Start Your Project?

Our platform offers tailored solutions for

your unique experimental needs, ensuring a seamless experience from project design to data delivery.


Privacy PolicyCookie PolicyCareers
banner laptop bg
banner mobile bg

Plant and Animal De novo Sequencing

De novo assembly of plant and animal genomes to enable accurate characterization of complex genomes and species-specific genomic features.
Request a Quote
(Plant and Animal De novo Sequencing)
Request a Quote
(Plant and Animal De novo Sequencing)
OverviewOverview
BenefitsBenefits
ApplicationsApplications
SpecificationsSpecifications
ResourcesResources

De novo sequencing involves sequencing and assembling the genome of a species without relying on a reference genome, thereby constructing a complete genomic sequence map of the species. This approach not only provides a comprehensive genomic sequence map but also lays the foundation for further research into the species' evolutionary origins and adaptations to specific environments.

With extensive experience in experimental operations and bioinformatics analyses, Novogene offers an accurate, rapid, and comprehensive characterization of species and generates reliable results. Furthermore, Novogene’s end-to-end services guarantee the ultra-fast turnaround time.

Benefits of  Novogene’s Plant and Animal De novo sequencing service

Extensive Experience

Proven expertise in assembling reference-quality genomes for diverse plant and animal species.

Extensive Experience

Proven expertise in assembling reference-quality genomes for diverse plant and animal species.

High-Quality Data
High-Quality Data

Delivering high-quality sequencing data with industry-standard performance and assembly-ready contig N50.

High-Quality Data
High-Quality Data

Delivering high-quality sequencing data with industry-standard performance and assembly-ready contig N50.

Short- and Long-Read Integration

Flexible de novo sequencing strategies combining long-read and short-read data for comprehensive genome assembly.

Short- and Long-Read Integration

Flexible de novo sequencing strategies combining long-read and short-read data for comprehensive genome assembly.

Advanced Bioinformatics Support

End-to-end assembly solutions from long-read data, with support for T2T genomes and chromosome-level assembly via Hi-C integration.

Advanced Bioinformatics Support

End-to-end assembly solutions from long-read data, with support for T2T genomes and chromosome-level assembly via Hi-C integration.

Customer Service System (CSS)

A centralized platform for project tracking, data access, and seamless collaboration throughout your sequencing workflow.

Customer Service System (CSS)

A centralized platform for project tracking, data access, and seamless collaboration throughout your sequencing workflow.

Benefits of  Novogene’s Plant and Animal De novo sequencing service

Extensive Experience

Proven expertise in assembling reference-quality genomes for diverse plant and animal species.

Extensive Experience

Proven expertise in assembling reference-quality genomes for diverse plant and animal species.

High-Quality Data
High-Quality Data

Delivering high-quality sequencing data with industry-standard performance and assembly-ready contig N50.

High-Quality Data
High-Quality Data

Delivering high-quality sequencing data with industry-standard performance and assembly-ready contig N50.

Short- and Long-Read Integration

Flexible de novo sequencing strategies combining long-read and short-read data for comprehensive genome assembly.

Short- and Long-Read Integration

Flexible de novo sequencing strategies combining long-read and short-read data for comprehensive genome assembly.

Advanced Bioinformatics Support

End-to-end assembly solutions from long-read data, with support for T2T genomes and chromosome-level assembly via Hi-C integration.

Advanced Bioinformatics Support

End-to-end assembly solutions from long-read data, with support for T2T genomes and chromosome-level assembly via Hi-C integration.

Customer Service System (CSS)

A centralized platform for project tracking, data access, and seamless collaboration throughout your sequencing workflow.

Customer Service System (CSS)

A centralized platform for project tracking, data access, and seamless collaboration throughout your sequencing workflow.

Applications of Plant and Animal De novo Sequencing

Conservation & Evolutionary Research (Animal)

Uncovers the genetic basis of environmental adaptation, traces evolutionary history, and provides critical insights for protecting endangered species.

Conservation & Evolutionary Research (Animal)

Uncovers the genetic basis of environmental adaptation, traces evolutionary history, and provides critical insights for protecting endangered species.

Agriculture & Livestock Breeding

Identifies genes associated with disease resistance, productivity, and desirable traits, enabling the development of healthier and higher-yielding breeds.

Agriculture & Livestock Breeding

Identifies genes associated with disease resistance, productivity, and desirable traits, enabling the development of healthier and higher-yielding breeds.

Biomedical Research & Drug Discovery

Facilitates the creation of better animal disease models (e.g., zebrafish) and aids drug discovery by revealing unique biological pathways from animals with special traits, such as cancer resistance.

Biomedical Research & Drug Discovery

Facilitates the creation of better animal disease models (e.g., zebrafish) and aids drug discovery by revealing unique biological pathways from animals with special traits, such as cancer resistance.

Crop Improvement & Food Security (Plant)

Provides the complete genetic blueprint to empower breeding of high-yield, nutrient-rich, and stress-resilient crop varieties, ensuring global food security.

Crop Improvement & Food Security (Plant)

Provides the complete genetic blueprint to empower breeding of high-yield, nutrient-rich, and stress-resilient crop varieties, ensuring global food security.

Evolution & Adaptation Studies (Plant)

Reveals evolutionary histories and deciphers the genetic mechanisms behind plant adaptation to environmental challenges.

Evolution & Adaptation Studies (Plant)

Reveals evolutionary histories and deciphers the genetic mechanisms behind plant adaptation to environmental challenges.

Genetic Resource Mining

Pioneers the discovery of novel genes responsible for valuable compounds and revolutionary agronomic traits, driving innovation across agriculture and biotechnology.

Genetic Resource Mining

Pioneers the discovery of novel genes responsible for valuable compounds and revolutionary agronomic traits, driving innovation across agriculture and biotechnology.

Applications of Plant and Animal De novo Sequencing

Conservation & Evolutionary Research (Animal)

Uncovers the genetic basis of environmental adaptation, traces evolutionary history, and provides critical insights for protecting endangered species.

Conservation & Evolutionary Research (Animal)

Uncovers the genetic basis of environmental adaptation, traces evolutionary history, and provides critical insights for protecting endangered species.

Agriculture & Livestock Breeding

Identifies genes associated with disease resistance, productivity, and desirable traits, enabling the development of healthier and higher-yielding breeds.

Agriculture & Livestock Breeding

Identifies genes associated with disease resistance, productivity, and desirable traits, enabling the development of healthier and higher-yielding breeds.

Biomedical Research & Drug Discovery

Facilitates the creation of better animal disease models (e.g., zebrafish) and aids drug discovery by revealing unique biological pathways from animals with special traits, such as cancer resistance.

Biomedical Research & Drug Discovery

Facilitates the creation of better animal disease models (e.g., zebrafish) and aids drug discovery by revealing unique biological pathways from animals with special traits, such as cancer resistance.

Crop Improvement & Food Security (Plant)

Provides the complete genetic blueprint to empower breeding of high-yield, nutrient-rich, and stress-resilient crop varieties, ensuring global food security.

Crop Improvement & Food Security (Plant)

Provides the complete genetic blueprint to empower breeding of high-yield, nutrient-rich, and stress-resilient crop varieties, ensuring global food security.

Evolution & Adaptation Studies (Plant)

Reveals evolutionary histories and deciphers the genetic mechanisms behind plant adaptation to environmental challenges.

Evolution & Adaptation Studies (Plant)

Reveals evolutionary histories and deciphers the genetic mechanisms behind plant adaptation to environmental challenges.

Genetic Resource Mining

Pioneers the discovery of novel genes responsible for valuable compounds and revolutionary agronomic traits, driving innovation across agriculture and biotechnology.

Genetic Resource Mining

Pioneers the discovery of novel genes responsible for valuable compounds and revolutionary agronomic traits, driving innovation across agriculture and biotechnology.

Specifications

Sample Requirements

Sample amounts are listed for reference only. Download the Sample Requirements to learn more. For detailed information, please contact us with your customized requests.

Platform TypeSample TypeAmount (Qubit®)Purity
Illumina NovaSeq SystemGenomic DNA≥ 200 ngOD260/280=1.8-2.0;
no degradation,
no contamination
PacBio Revio SystemHMW Genomic DNA≥ 3.5 μgOD260/280=1.75~2.0;
OD260/230=1.5~2.6;
*NC/QC=1.00~2.20;
Fragments should be ≥30K
Nanopore PromethIONHMW Genomic DNA≥ 8.5 μgOD260/280=1.75~2.0;
OD260/230=1.4~2.6;
*NC/QC=0.95~3.00
Fragments should be ≥30K
Nanopore PromethION
(Nanopore Ultra-long DNA Library)
uHMW Genomic DNA≥ 20 μgOD260/280=1.7-2.0;
OD260/230=1.3-2.6;
*NC/QC=0.95-3.00;
Fragments should be ≥ 100k, no fragments below 30k.
*NC/QC = NanoDrop concentration/Qubit concentration

Sample Requirements

Sample amounts are listed for reference only. Download the Sample Requirements to learn more. For detailed information, please contact us with your customized requests.

Platform TypeSample TypeAmount (Qubit®)Purity
Illumina NovaSeq SystemGenomic DNA≥ 200 ngOD260/280=1.8-2.0;
no degradation,
no contamination
PacBio Revio SystemHMW Genomic DNA≥ 3.5 μgOD260/280=1.75~2.0;
OD260/230=1.5~2.6;
*NC/QC=1.00~2.20;
Fragments should be ≥30K
Nanopore PromethIONHMW Genomic DNA≥ 8.5 μgOD260/280=1.75~2.0;
OD260/230=1.4~2.6;
*NC/QC=0.95~3.00
Fragments should be ≥30K
Nanopore PromethION
(Nanopore Ultra-long DNA Library)
uHMW Genomic DNA≥ 20 μgOD260/280=1.7-2.0;
OD260/230=1.3-2.6;
*NC/QC=0.95-3.00;
Fragments should be ≥ 100k, no fragments below 30k.
*NC/QC = NanoDrop concentration/Qubit concentration

Sample Requirements

Sample amounts are listed for reference only. Download the Sample Requirements to learn more. For detailed information, please contact us with your customized requests.

Platform TypeSample TypeAmount (Qubit®)Purity
Illumina NovaSeq SystemGenomic DNA≥ 200 ngOD260/280=1.8-2.0;
no degradation,
no contamination
PacBio Revio SystemHMW Genomic DNA≥ 3.5 μgOD260/280=1.75~2.0;
OD260/230=1.5~2.6;
*NC/QC=1.00~2.20;
Fragments should be ≥30K
Nanopore PromethIONHMW Genomic DNA≥ 8.5 μgOD260/280=1.75~2.0;
OD260/230=1.4~2.6;
*NC/QC=0.95~3.00
Fragments should be ≥30K
Nanopore PromethION
(Nanopore Ultra-long DNA Library)
uHMW Genomic DNA≥ 20 μgOD260/280=1.7-2.0;
OD260/230=1.3-2.6;
*NC/QC=0.95-3.00;
Fragments should be ≥ 100k, no fragments below 30k.
*NC/QC = NanoDrop concentration/Qubit concentration

Sample Requirements

Sample amounts are listed for reference only. Download the Sample Requirements to learn more. For detailed information, please contact us with your customized requests.

Platform TypeSample TypeAmount (Qubit®)Purity
Illumina NovaSeq SystemGenomic DNA≥ 200 ngOD260/280=1.8-2.0;
no degradation,
no contamination
PacBio Revio SystemHMW Genomic DNA≥ 3.5 μgOD260/280=1.75~2.0;
OD260/230=1.5~2.6;
*NC/QC=1.00~2.20;
Fragments should be ≥30K
Nanopore PromethIONHMW Genomic DNA≥ 8.5 μgOD260/280=1.75~2.0;
OD260/230=1.4~2.6;
*NC/QC=0.95~3.00
Fragments should be ≥30K
Nanopore PromethION
(Nanopore Ultra-long DNA Library)
uHMW Genomic DNA≥ 20 μgOD260/280=1.7-2.0;
OD260/230=1.3-2.6;
*NC/QC=0.95-3.00;
Fragments should be ≥ 100k, no fragments below 30k.
*NC/QC = NanoDrop concentration/Qubit concentration

Sequencing and Analysis

Recommended data outputs and analysis contents displayed are for reference only. For detailed information, please contact us with your customized requests.

Sequencing TypeIllumina NovaSeq SystemPacBio Revio SystemNanopore PromethION System
Read LengthPaired-end 150 bpN50>15 kbAverage > 50 kb
Recommended  Sequencing DepthFor genome survey or assembly polishing: ≥ 50×
RNA requires 4 to 6 different tissue sites.
For genome assembly: ≥ 30×
Standard AnalysisK-mer analysis
GC content analysis
Repeat content rate evaluation
Heterozygous rate evaluation
Genome size evaluation
Long-read assembly
Assembly statistics
Gene completeness evaluation
Genome Annotation-Repeat prediction
Structure prediction
Function prediction
Noncoding RNA prediction

Project Workflow

Project Workflow

Sequencing and Analysis

Recommended data outputs and analysis contents displayed are for reference only. For detailed information, please contact us with your customized requests.

Sequencing TypeIllumina NovaSeq SystemPacBio Revio SystemNanopore PromethION System
Read LengthPaired-end 150 bpN50>15 kbAverage > 50 kb
Recommended  Sequencing DepthFor genome survey or assembly polishing: ≥ 50×
RNA requires 4 to 6 different tissue sites.
For genome assembly: ≥ 30×
Standard AnalysisK-mer analysis
GC content analysis
Repeat content rate evaluation
Heterozygous rate evaluation
Genome size evaluation
Long-read assembly
Assembly statistics
Gene completeness evaluation
Genome Annotation-Repeat prediction
Structure prediction
Function prediction
Noncoding RNA prediction

Project Workflow

Project Workflow

Sequencing and Analysis

Recommended data outputs and analysis contents displayed are for reference only. For detailed information, please contact us with your customized requests.

Sequencing TypeIllumina NovaSeq SystemPacBio Revio SystemNanopore PromethION System
Read LengthPaired-end 150 bpN50>15 kbAverage > 50 kb
Recommended  Sequencing DepthFor genome survey or assembly polishing: ≥ 50×
RNA requires 4 to 6 different tissue sites.
For genome assembly: ≥ 30×
Standard AnalysisK-mer analysis
GC content analysis
Repeat content rate evaluation
Heterozygous rate evaluation
Genome size evaluation
Long-read assembly
Assembly statistics
Gene completeness evaluation
Genome Annotation-Repeat prediction
Structure prediction
Function prediction
Noncoding RNA prediction

Project Workflow

Project Workflow

Sequencing and Analysis

Recommended data outputs and analysis contents displayed are for reference only. For detailed information, please contact us with your customized requests.

Sequencing TypeIllumina NovaSeq SystemPacBio Revio SystemNanopore PromethION System
Read LengthPaired-end 150 bpN50>15 kbAverage > 50 kb
Recommended  Sequencing DepthFor genome survey or assembly polishing: ≥ 50×
RNA requires 4 to 6 different tissue sites.
For genome assembly: ≥ 30×
Standard AnalysisK-mer analysis
GC content analysis
Repeat content rate evaluation
Heterozygous rate evaluation
Genome size evaluation
Long-read assembly
Assembly statistics
Gene completeness evaluation
Genome Annotation-Repeat prediction
Structure prediction
Function prediction
Noncoding RNA prediction

Project Workflow

Project Workflow

Specifications

Sample Requirements

Sample amounts are listed for reference only. Download the Sample Requirements to learn more. For detailed information, please contact us with your customized requests.

Platform TypeSample TypeAmount (Qubit®)Purity
Illumina NovaSeq SystemGenomic DNA≥ 200 ngOD260/280=1.8-2.0;
no degradation,
no contamination
PacBio Revio SystemHMW Genomic DNA≥ 3.5 μgOD260/280=1.75~2.0;
OD260/230=1.5~2.6;
*NC/QC=1.00~2.20;
Fragments should be ≥30K
Nanopore PromethIONHMW Genomic DNA≥ 8.5 μgOD260/280=1.75~2.0;
OD260/230=1.4~2.6;
*NC/QC=0.95~3.00
Fragments should be ≥30K
Nanopore PromethION
(Nanopore Ultra-long DNA Library)
uHMW Genomic DNA≥ 20 μgOD260/280=1.7-2.0;
OD260/230=1.3-2.6;
*NC/QC=0.95-3.00;
Fragments should be ≥ 100k, no fragments below 30k.
*NC/QC = NanoDrop concentration/Qubit concentration

Sample Requirements

Sample amounts are listed for reference only. Download the Sample Requirements to learn more. For detailed information, please contact us with your customized requests.

Platform TypeSample TypeAmount (Qubit®)Purity
Illumina NovaSeq SystemGenomic DNA≥ 200 ngOD260/280=1.8-2.0;
no degradation,
no contamination
PacBio Revio SystemHMW Genomic DNA≥ 3.5 μgOD260/280=1.75~2.0;
OD260/230=1.5~2.6;
*NC/QC=1.00~2.20;
Fragments should be ≥30K
Nanopore PromethIONHMW Genomic DNA≥ 8.5 μgOD260/280=1.75~2.0;
OD260/230=1.4~2.6;
*NC/QC=0.95~3.00
Fragments should be ≥30K
Nanopore PromethION
(Nanopore Ultra-long DNA Library)
uHMW Genomic DNA≥ 20 μgOD260/280=1.7-2.0;
OD260/230=1.3-2.6;
*NC/QC=0.95-3.00;
Fragments should be ≥ 100k, no fragments below 30k.
*NC/QC = NanoDrop concentration/Qubit concentration

Sample Requirements

Sample amounts are listed for reference only. Download the Sample Requirements to learn more. For detailed information, please contact us with your customized requests.

Platform TypeSample TypeAmount (Qubit®)Purity
Illumina NovaSeq SystemGenomic DNA≥ 200 ngOD260/280=1.8-2.0;
no degradation,
no contamination
PacBio Revio SystemHMW Genomic DNA≥ 3.5 μgOD260/280=1.75~2.0;
OD260/230=1.5~2.6;
*NC/QC=1.00~2.20;
Fragments should be ≥30K
Nanopore PromethIONHMW Genomic DNA≥ 8.5 μgOD260/280=1.75~2.0;
OD260/230=1.4~2.6;
*NC/QC=0.95~3.00
Fragments should be ≥30K
Nanopore PromethION
(Nanopore Ultra-long DNA Library)
uHMW Genomic DNA≥ 20 μgOD260/280=1.7-2.0;
OD260/230=1.3-2.6;
*NC/QC=0.95-3.00;
Fragments should be ≥ 100k, no fragments below 30k.
*NC/QC = NanoDrop concentration/Qubit concentration

Sample Requirements

Sample amounts are listed for reference only. Download the Sample Requirements to learn more. For detailed information, please contact us with your customized requests.

Platform TypeSample TypeAmount (Qubit®)Purity
Illumina NovaSeq SystemGenomic DNA≥ 200 ngOD260/280=1.8-2.0;
no degradation,
no contamination
PacBio Revio SystemHMW Genomic DNA≥ 3.5 μgOD260/280=1.75~2.0;
OD260/230=1.5~2.6;
*NC/QC=1.00~2.20;
Fragments should be ≥30K
Nanopore PromethIONHMW Genomic DNA≥ 8.5 μgOD260/280=1.75~2.0;
OD260/230=1.4~2.6;
*NC/QC=0.95~3.00
Fragments should be ≥30K
Nanopore PromethION
(Nanopore Ultra-long DNA Library)
uHMW Genomic DNA≥ 20 μgOD260/280=1.7-2.0;
OD260/230=1.3-2.6;
*NC/QC=0.95-3.00;
Fragments should be ≥ 100k, no fragments below 30k.
*NC/QC = NanoDrop concentration/Qubit concentration

Sequencing and Analysis

Recommended data outputs and analysis contents displayed are for reference only. For detailed information, please contact us with your customized requests.

Sequencing TypeIllumina NovaSeq SystemPacBio Revio SystemNanopore PromethION System
Read LengthPaired-end 150 bpN50>15 kbAverage > 50 kb
Recommended  Sequencing DepthFor genome survey or assembly polishing: ≥ 50×
RNA requires 4 to 6 different tissue sites.
For genome assembly: ≥ 30×
Standard AnalysisK-mer analysis
GC content analysis
Repeat content rate evaluation
Heterozygous rate evaluation
Genome size evaluation
Long-read assembly
Assembly statistics
Gene completeness evaluation
Genome Annotation-Repeat prediction
Structure prediction
Function prediction
Noncoding RNA prediction

Project Workflow

Project Workflow

Sequencing and Analysis

Recommended data outputs and analysis contents displayed are for reference only. For detailed information, please contact us with your customized requests.

Sequencing TypeIllumina NovaSeq SystemPacBio Revio SystemNanopore PromethION System
Read LengthPaired-end 150 bpN50>15 kbAverage > 50 kb
Recommended  Sequencing DepthFor genome survey or assembly polishing: ≥ 50×
RNA requires 4 to 6 different tissue sites.
For genome assembly: ≥ 30×
Standard AnalysisK-mer analysis
GC content analysis
Repeat content rate evaluation
Heterozygous rate evaluation
Genome size evaluation
Long-read assembly
Assembly statistics
Gene completeness evaluation
Genome Annotation-Repeat prediction
Structure prediction
Function prediction
Noncoding RNA prediction

Project Workflow

Project Workflow

Sequencing and Analysis

Recommended data outputs and analysis contents displayed are for reference only. For detailed information, please contact us with your customized requests.

Sequencing TypeIllumina NovaSeq SystemPacBio Revio SystemNanopore PromethION System
Read LengthPaired-end 150 bpN50>15 kbAverage > 50 kb
Recommended  Sequencing DepthFor genome survey or assembly polishing: ≥ 50×
RNA requires 4 to 6 different tissue sites.
For genome assembly: ≥ 30×
Standard AnalysisK-mer analysis
GC content analysis
Repeat content rate evaluation
Heterozygous rate evaluation
Genome size evaluation
Long-read assembly
Assembly statistics
Gene completeness evaluation
Genome Annotation-Repeat prediction
Structure prediction
Function prediction
Noncoding RNA prediction

Project Workflow

Project Workflow

Sequencing and Analysis

Recommended data outputs and analysis contents displayed are for reference only. For detailed information, please contact us with your customized requests.

Sequencing TypeIllumina NovaSeq SystemPacBio Revio SystemNanopore PromethION System
Read LengthPaired-end 150 bpN50>15 kbAverage > 50 kb
Recommended  Sequencing DepthFor genome survey or assembly polishing: ≥ 50×
RNA requires 4 to 6 different tissue sites.
For genome assembly: ≥ 30×
Standard AnalysisK-mer analysis
GC content analysis
Repeat content rate evaluation
Heterozygous rate evaluation
Genome size evaluation
Long-read assembly
Assembly statistics
Gene completeness evaluation
Genome Annotation-Repeat prediction
Structure prediction
Function prediction
Noncoding RNA prediction

Project Workflow

Project Workflow

Demo Results

Image
Image
1/1
Assembly Statistics

Grain Aphid genome A/T/G/C content statistics

Image
Image
1/1
Assembly Evaluation - BUSCO Assessment

BUSCO assessment results

Note: C: Complete BUSCOs; S: Complete and single-copy BUSCOs; D: Complete Duplicated BUSCOs; F: Fragmented BUSCOs; M: Missing BUSCOs; n: Total BUSCO groups searched

Image
Image
1/1
GC Content and Depth Distribution

X-axis: GC contents; y-axis: sequencing depth.

Upper: GC content distribution.

Lower right: sequencing depth distribution.

Image
Image
1/1
Evidence Support

Venn diagram of gene set evidence support. Augustus, GlimmerHMM, SNAP, Geneid and Genscan are used in De novo gene structure prediction.

Image
Image
1/1
Function Prediction

Venn diagram of gene function annotationProtein sequences predicted by gene structure are aligned with known protein databases. Results suggest that the function of 95.8% of the genes could be predicted.

Image
Image
1/1
Assembly Statistics

Grain Aphid genome A/T/G/C content statistics

Image
Image
1/1
Assembly Evaluation - BUSCO Assessment

BUSCO assessment results

Note: C: Complete BUSCOs; S: Complete and single-copy BUSCOs; D: Complete Duplicated BUSCOs; F: Fragmented BUSCOs; M: Missing BUSCOs; n: Total BUSCO groups searched

Image
Image
1/1
GC Content and Depth Distribution

X-axis: GC contents; y-axis: sequencing depth.

Upper: GC content distribution.

Lower right: sequencing depth distribution.

Image
Image
1/1
Evidence Support

Venn diagram of gene set evidence support. Augustus, GlimmerHMM, SNAP, Geneid and Genscan are used in De novo gene structure prediction.

Image
Image
1/1
Function Prediction

Venn diagram of gene function annotationProtein sequences predicted by gene structure are aligned with known protein databases. Results suggest that the function of 95.8% of the genes could be predicted.

Demo Results

Image
Image
1/1
Assembly Statistics

Grain Aphid genome A/T/G/C content statistics

Image
Image
1/1
Assembly Evaluation - BUSCO Assessment

BUSCO assessment results

Note: C: Complete BUSCOs; S: Complete and single-copy BUSCOs; D: Complete Duplicated BUSCOs; F: Fragmented BUSCOs; M: Missing BUSCOs; n: Total BUSCO groups searched

Image
Image
1/1
GC Content and Depth Distribution

X-axis: GC contents; y-axis: sequencing depth.

Upper: GC content distribution.

Lower right: sequencing depth distribution.

Image
Image
1/1
Evidence Support

Venn diagram of gene set evidence support. Augustus, GlimmerHMM, SNAP, Geneid and Genscan are used in De novo gene structure prediction.

Image
Image
1/1
Function Prediction

Venn diagram of gene function annotationProtein sequences predicted by gene structure are aligned with known protein databases. Results suggest that the function of 95.8% of the genes could be predicted.

Image
Image
1/1
Assembly Statistics

Grain Aphid genome A/T/G/C content statistics

Image
Image
1/1
Assembly Evaluation - BUSCO Assessment

BUSCO assessment results

Note: C: Complete BUSCOs; S: Complete and single-copy BUSCOs; D: Complete Duplicated BUSCOs; F: Fragmented BUSCOs; M: Missing BUSCOs; n: Total BUSCO groups searched

Image
Image
1/1
GC Content and Depth Distribution

X-axis: GC contents; y-axis: sequencing depth.

Upper: GC content distribution.

Lower right: sequencing depth distribution.

Image
Image
1/1
Evidence Support

Venn diagram of gene set evidence support. Augustus, GlimmerHMM, SNAP, Geneid and Genscan are used in De novo gene structure prediction.

Image
Image
1/1
Function Prediction

Venn diagram of gene function annotationProtein sequences predicted by gene structure are aligned with known protein databases. Results suggest that the function of 95.8% of the genes could be predicted.

K-mer Analysis

Kmer=17 analyses and genome size evaluation

SampleKmerDepthn_kmerGenome_size(M)Genome_size(M)Genome_size(M)Repeat_rate(%)
plant173624,079,467,724668.87668.87668.8773
(1) K-mer: Selected K-mer length.
(2) Depth:The expected value of K-mer depth.
(3) n_K-mer:The total number of K-mer from SOAPdenovo.
(4) Genome size(M):The genome size in Mb estimated by formula: Genome Size=K-mer_num/Peak_depth.
(5) Revise Genome size(M):Revised genome size after error correction from wrong K-mer.
(6) Heteozygous ratio:The percent of heteozygous positions.
(7) Repeat:Calculated by the percentage of K-mer numbers after 1.8-fold of the main peak of total K-mer numbers.
Note: The repeat here is a mathematically repeated sequence but not a repeat element with certain biological functions.
SampleKmerDepthn_kmerGenome_size(M)Genome_size(M)Genome_size(M)Repeat_rate(%)
plant173624,079,467,724668.87668.87668.8773
(1) K-mer: Selected K-mer length.
(2) Depth:The expected value of K-mer depth.
(3) n_K-mer:The total number of K-mer from SOAPdenovo.
(4) Genome size(M):The genome size in Mb estimated by formula: Genome Size=K-mer_num/Peak_depth.
(5) Revise Genome size(M):Revised genome size after error correction from wrong K-mer.
(6) Heteozygous ratio:The percent of heteozygous positions.
(7) Repeat:Calculated by the percentage of K-mer numbers after 1.8-fold of the main peak of total K-mer numbers.
Note: The repeat here is a mathematically repeated sequence but not a repeat element with certain biological functions.
SampleKmerDepthn_kmerGenome_size(M)Genome_size(M)Genome_size(M)Repeat_rate(%)
plant173624,079,467,724668.87668.87668.8773
(1) K-mer: Selected K-mer length.
(2) Depth:The expected value of K-mer depth.
(3) n_K-mer:The total number of K-mer from SOAPdenovo.
(4) Genome size(M):The genome size in Mb estimated by formula: Genome Size=K-mer_num/Peak_depth.
(5) Revise Genome size(M):Revised genome size after error correction from wrong K-mer.
(6) Heteozygous ratio:The percent of heteozygous positions.
(7) Repeat:Calculated by the percentage of K-mer numbers after 1.8-fold of the main peak of total K-mer numbers.
Note: The repeat here is a mathematically repeated sequence but not a repeat element with certain biological functions.
SampleKmerDepthn_kmerGenome_size(M)Genome_size(M)Genome_size(M)Repeat_rate(%)
plant173624,079,467,724668.87668.87668.8773
(1) K-mer: Selected K-mer length.
(2) Depth:The expected value of K-mer depth.
(3) n_K-mer:The total number of K-mer from SOAPdenovo.
(4) Genome size(M):The genome size in Mb estimated by formula: Genome Size=K-mer_num/Peak_depth.
(5) Revise Genome size(M):Revised genome size after error correction from wrong K-mer.
(6) Heteozygous ratio:The percent of heteozygous positions.
(7) Repeat:Calculated by the percentage of K-mer numbers after 1.8-fold of the main peak of total K-mer numbers.
Note: The repeat here is a mathematically repeated sequence but not a repeat element with certain biological functions.

K-mer Analysis

Kmer=17 analyses and genome size evaluation

SampleKmerDepthn_kmerGenome_size(M)Genome_size(M)Genome_size(M)Repeat_rate(%)
plant173624,079,467,724668.87668.87668.8773
(1) K-mer: Selected K-mer length.
(2) Depth:The expected value of K-mer depth.
(3) n_K-mer:The total number of K-mer from SOAPdenovo.
(4) Genome size(M):The genome size in Mb estimated by formula: Genome Size=K-mer_num/Peak_depth.
(5) Revise Genome size(M):Revised genome size after error correction from wrong K-mer.
(6) Heteozygous ratio:The percent of heteozygous positions.
(7) Repeat:Calculated by the percentage of K-mer numbers after 1.8-fold of the main peak of total K-mer numbers.
Note: The repeat here is a mathematically repeated sequence but not a repeat element with certain biological functions.
SampleKmerDepthn_kmerGenome_size(M)Genome_size(M)Genome_size(M)Repeat_rate(%)
plant173624,079,467,724668.87668.87668.8773
(1) K-mer: Selected K-mer length.
(2) Depth:The expected value of K-mer depth.
(3) n_K-mer:The total number of K-mer from SOAPdenovo.
(4) Genome size(M):The genome size in Mb estimated by formula: Genome Size=K-mer_num/Peak_depth.
(5) Revise Genome size(M):Revised genome size after error correction from wrong K-mer.
(6) Heteozygous ratio:The percent of heteozygous positions.
(7) Repeat:Calculated by the percentage of K-mer numbers after 1.8-fold of the main peak of total K-mer numbers.
Note: The repeat here is a mathematically repeated sequence but not a repeat element with certain biological functions.
SampleKmerDepthn_kmerGenome_size(M)Genome_size(M)Genome_size(M)Repeat_rate(%)
plant173624,079,467,724668.87668.87668.8773
(1) K-mer: Selected K-mer length.
(2) Depth:The expected value of K-mer depth.
(3) n_K-mer:The total number of K-mer from SOAPdenovo.
(4) Genome size(M):The genome size in Mb estimated by formula: Genome Size=K-mer_num/Peak_depth.
(5) Revise Genome size(M):Revised genome size after error correction from wrong K-mer.
(6) Heteozygous ratio:The percent of heteozygous positions.
(7) Repeat:Calculated by the percentage of K-mer numbers after 1.8-fold of the main peak of total K-mer numbers.
Note: The repeat here is a mathematically repeated sequence but not a repeat element with certain biological functions.
SampleKmerDepthn_kmerGenome_size(M)Genome_size(M)Genome_size(M)Repeat_rate(%)
plant173624,079,467,724668.87668.87668.8773
(1) K-mer: Selected K-mer length.
(2) Depth:The expected value of K-mer depth.
(3) n_K-mer:The total number of K-mer from SOAPdenovo.
(4) Genome size(M):The genome size in Mb estimated by formula: Genome Size=K-mer_num/Peak_depth.
(5) Revise Genome size(M):Revised genome size after error correction from wrong K-mer.
(6) Heteozygous ratio:The percent of heteozygous positions.
(7) Repeat:Calculated by the percentage of K-mer numbers after 1.8-fold of the main peak of total K-mer numbers.
Note: The repeat here is a mathematically repeated sequence but not a repeat element with certain biological functions.

Frequently Asked Questions

How to Ensure the Reliability of Assembly Results? What Are the Main Methods for Evaluating Assembly Completeness and Accuracy?

In addition to ensuring Contig N50 and Scaffold N50 metrics, it is essential to evaluate the quality of the assembly. Common evaluation methods include BUSCO, LAI, Merqury, CEGMA, EST sequence assessment, RNA sequence assessment, and consensus evaluation. Among these, BUSCO assesses the genome using a library of single-copy orthologous genes, LAI evaluates genome completeness based on long terminal repeat retrotransposons, and Merqury assesses the genome's QV (Quality Value). These three evaluation methods are currently the most widely used.

What is the Recommended Strategy for De Novo Assembly?

Does Survey and Genome De Novo Require the Same DNA?

More Services

Total RNA Sequencing
(Total RNA Sequencing)
Total RNA Sequencing
(Total RNA Sequencing)
Full-Length Transcriptome Sequencin
(Full-Length Transcriptome Sequencin)
Full-Length Transcriptome Sequencin
(Full-Length Transcriptome Sequencin)
Plant and Animal Whole Genome Sequencing
(Plant and Animal Whole Genome Sequencing)
Plant and Animal Whole Genome Sequencing
(Plant and Animal Whole Genome Sequencing)

More Services

Total RNA Sequencing
(Total RNA Sequencing)
Total RNA Sequencing
(Total RNA Sequencing)
Full-Length Transcriptome Sequencin
(Full-Length Transcriptome Sequencin)
Full-Length Transcriptome Sequencin
(Full-Length Transcriptome Sequencin)
Plant and Animal Whole Genome Sequencing
(Plant and Animal Whole Genome Sequencing)
Plant and Animal Whole Genome Sequencing
(Plant and Animal Whole Genome Sequencing)
Background
Background

Ready to Start Your Project?

Our platform offers tailored solutions for

your unique experimental needs, ensuring a seamless experience from project design to data delivery.


Privacy PolicyCookie PolicyCareers