
Novogene AMEA
  • Novogene AMEA
  • Genomics
    • Human Whole Genome Sequencing
    • Plant and Animal Whole Genome Sequencing
    • Microbial Whole Genome Sequencing
    • Plant and Animal De novo Sequencing
    • Microbial De novo Sequencing
    • Shotgun Metagenomics Sequencing
    • Amplicon Sequencing
    • Whole Exome Sequencing
    Transcriptomics
    • mRNA Sequencing
    • Total RNA Sequencing
    • Full-Length Transcriptome Sequencing
    • Whole Transcriptome Sequencing
    • Small RNA Sequencing
    • Circular RNA Sequencing
    • Metatranscriptome Sequencing
    • Prokaryotic RNA Sequencing
    Single Cell & Spatial Omics
    • Single Cell Gene Expression
    • Single Cell Immune Profiling Sequencing
    • Single Cell Long Read Transcriptome
    • Visium HD Spatial Gene Expression
    • Stereo-Seq Spatial Gene Expression
    • Xenium In Situ Spatial Transcriptome
    Epigenomics
    • Whole Genome Bisulfite Sequencing (WGBS)
    • Directed DNA Methylation Sequencing (DM-Seq) NEW
    • Reduced Representation Bisulfite Sequencing (RRBS)
    • Chromatin Immunoprecipitation Sequencing (ChIP-seq)
    • RNA Immunoprecipitation Sequencing (RIP-seq)
    • Assay for Transposase-Accessible Chromatin with Sequencing (ATAC-seq)

    Premade Library

    • Sequencing Only on Illumina Sequencer
    • Sequencing Only on PacBio Sequencer
    Proteomics and Metabolomics
    • Olink Proteomics
    • Quantitative Proteomics
    • Untargeted Metabolomics
  • PromotionsPromotions
    • Platforms
    • Automated Delivery Platform (Falcon)
    • Bioinformatics Analysis Tool (NovoMagic)
    • Customer Service System (CSS)
    • Brochures
    • Case Studies
    • Webinar
    • Blog
    • Sample Guidelines
    • Cancer Research
    • Immuno-oncology
    • Agrigenomics
    • Environment
    • Food Science
    • Human Microbiome
    • Plant and Animal Microbiome
    • Drug Discovery and Development
    • Rare and Complex Diseases
    • About Us
    • Our Locations
    • News
    • Careers
  • Contact UsContact Us
  1. Home
  2. Resources
  3. Blog
  4. ClusterProfiler – A software for functional enrichment of differentially expressed genes.

ClusterProfiler – A software for functional enrichment of differentially expressed genes.

DNA and RNA sequencing has been a very significant part of molecular biology. RNA sequencing especially anchors itself to the problem of identifying the underlying basis of phenotypic variation. The scope of the phenotypic variation spans from the population level differences in certain biological trait to disease pathology of an individual or a group of individuals. But there are few questions: How to get the huge and complicated sequencing results to make the sequencing data more meaningful, how to select genes related to the biological phenotype, and how to discover the biological pathways that play a key role in the biological process? , to reveal and understand the biology and the basic molecular mechanism of the process. This is where quantification of expressed genes and further refinement of the significant gene candidates takes place.

The analyses of RNA sequence data usually involve identifying genes that respond to a particular stimulus, experimental treatment or show phenotypic differences between two biological groups. The process of quantifying the RNA sequence reads and estimating the variation in transcriptome profiles is called DGEA (Differential Gene Expression Analyses). There are several web and desktop tools (R and python packages) to run DGEA on the aligned RNAseq data. The next step after the DGEA is to further refine the transcriptome profiles by gene families and functions. The main reason for doing this is to identify a group of genes that belong to a certain functional group which will help us justify the phenotype differences between the groups or variation in phenotypic response between the treatment groups. The tools for functional analyses of differentially expressed genes span a variety of methods and are put in 3 major categories: ORA (Over representation analysis), FCS (Functional Class Scoring), and PT (Path Topology).

The overall goal of functional analysis is to provide biological insight into the mechanism of gene to phenotype path. Any identified differentially expressed gene candidates should be analyzed in the context of our experimental hypothesis: e.g say we make a hypothesis that, “FMRP and MOV10 associate and regulate the translation of a subset of RNAs”. This hypothesis would need to be specifically tested to see if a RNAseq candidate shows a significant DGE. Furthermore, the test should be followed on to check if the expression differences are also significant when accounting for the expression of background genes. Therefore, based on the authors’ hypothesis, we may expect the enrichment of processes/pathways related to translation, splicing, and the regulation of mRNAs, which we would need to validate experimentally.

What is “Cluster Profiler”?

“Cluster Profiler” is a R package that provides a statistical tests of over-representation analyses of the GO (gene ontology) terms associated with the list of genes that have shown statistically significant expression differences. The tool takes two inputs: a list of genes that has shown significant expression differences and a list of background gens. A statistical enrichment analysis test is performed using hypergeometric testing. The basic argument of the package allows selecting among GO ontology measures BP (Biological Process), CC (Cellular Component), MF (Molecular Function) to test.

The package supports the following type of analyses:

  • Over-Representation Analysis : This is a statistical method that determines whether genes from pre-defined sets (ex: those belonging to a specific GO term or KEGG pathway) are present more than would be expected (over-represented) in a subset of your data.
  • Gene Set Enrichment Analysis : Gene set enrichment analysis (GSEA) (also functional enrichment analysis) is a method to identify classes of genes or proteins that are over-represented in a large set of genes or proteins and may have an association with disease phenotypes. Here, we describe a powerful analytical method called Gene Set Enrichment Analysis (GSEA) for interpreting gene expression data. The method derives its power by focusing on gene sets, that is, groups of genes that share common biological function, chromosomal location, or regulation.
  • Biological theme comparison : After enrichment and categorizing significantly expressed genes in several gene cluster, researcher may be further interested in identifying and comparing the biological themes among gene clusters.

This package is available on bioconductor https://bioconductor.org/packages/release/bioc/html/clusterProfiler.html

This package implements methods to analyze and visualize functional profiles (GO and KEGG) of gene and gene clusters.

The package takes input data from different sources (microarray, RNAseq). After differential analysis, ordinary enrichment analysis (ORA) can be performed using the packages and tools like enrichGO, KEGG.

Package Usage
1.id conversion

For common model species, you can use the OrgDb annotation package in Bioconductor to achieve id conversion (so far supports annotations for 20 different species, such as humans, mice, fruit flies, zebrafish, etc.).
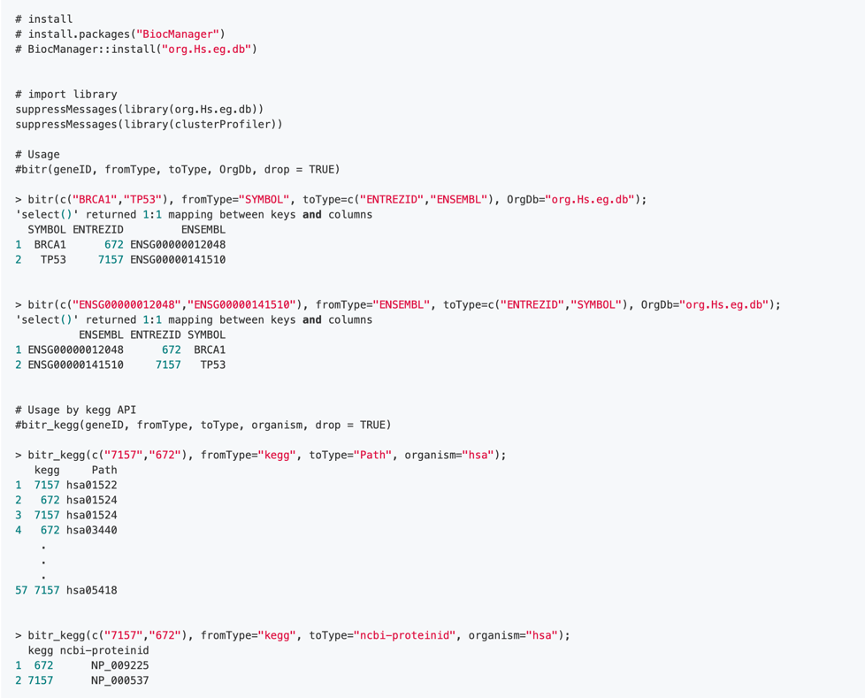
For unusual non-model species, this can be achieved through AnnotationHub.

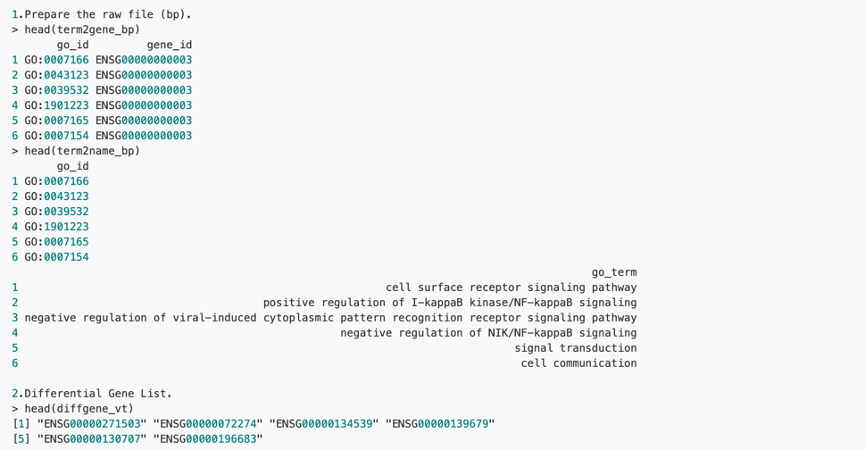
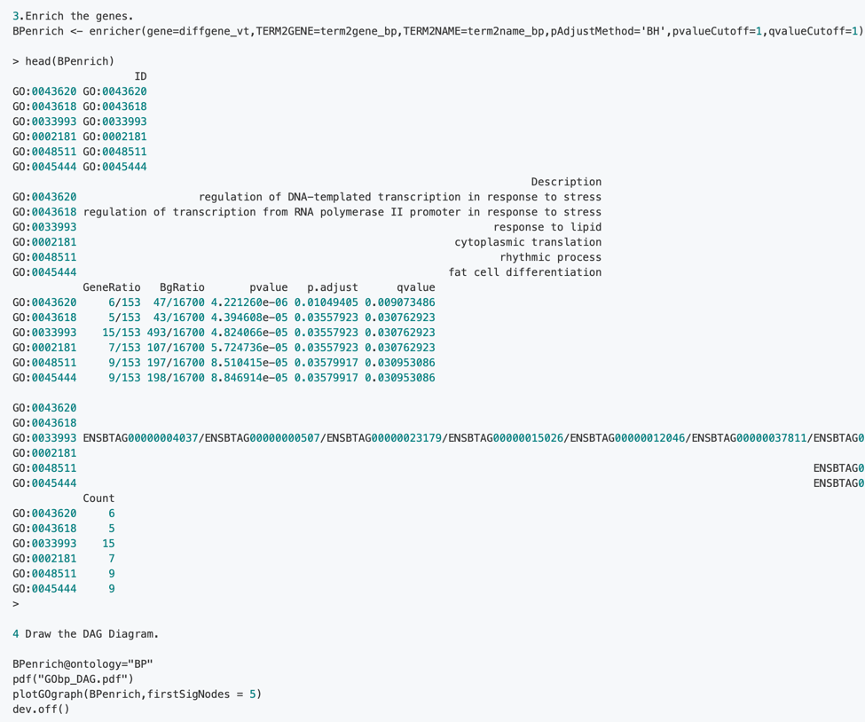
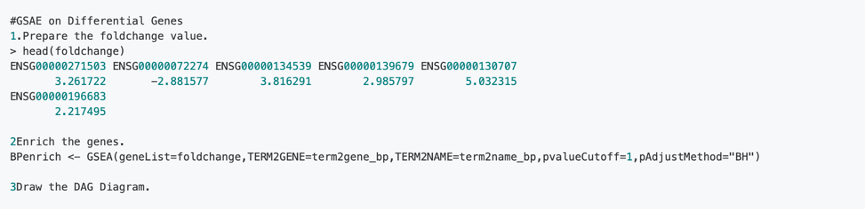
2. Enrichment analysis GO/KEGG/GSEA
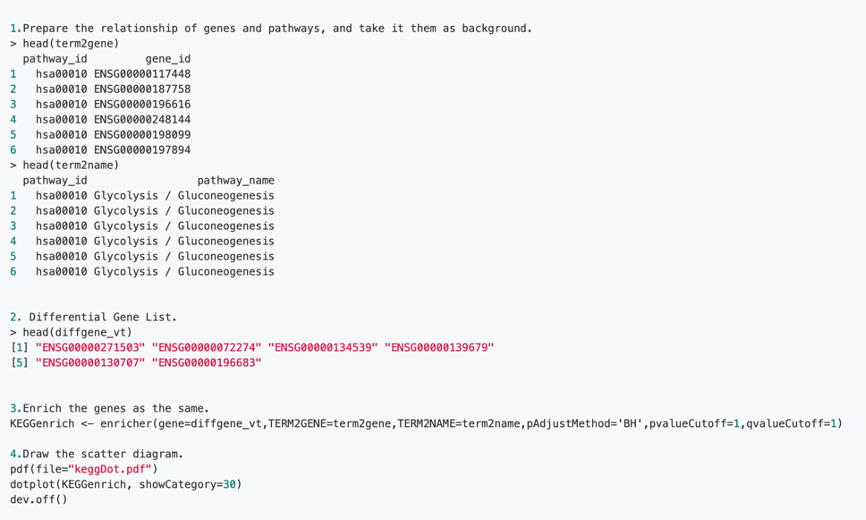
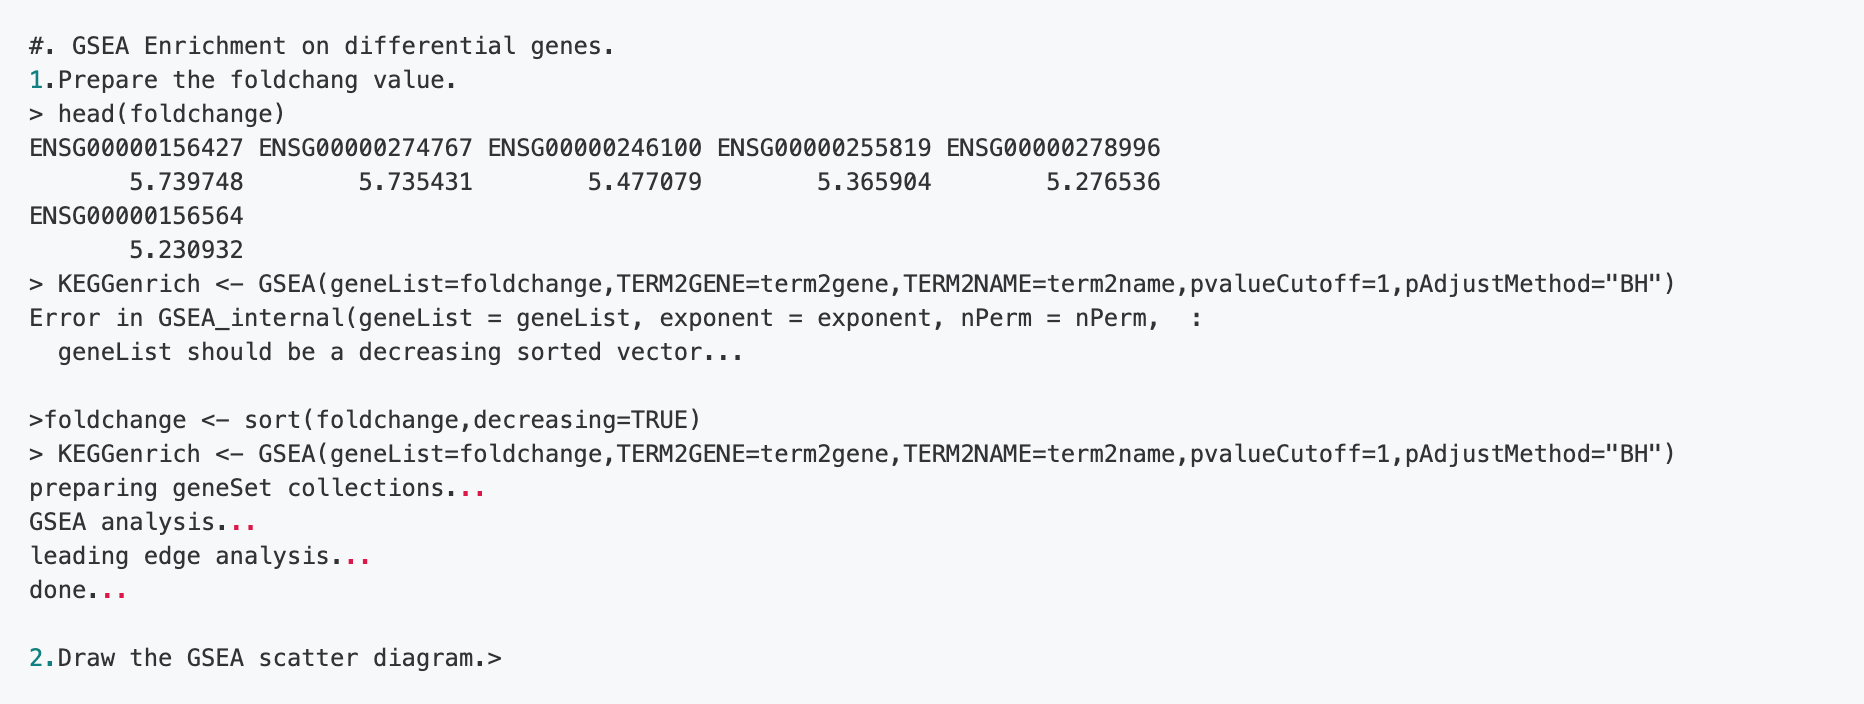
2.1 The specific steps of GO are as follows: 2.2 The specific operation steps of GO GSEA enrichment are as follows: 2.3 The specific steps of KEGG are as follows: 2.4 The specific steps of GSEA enrichment of KEGG are as follows:
ServicesServices menu

SupportSupport menu

CompanyCompany menu

Services
Whole Genome SequencingDe novo SequencingAmplicon SequencingShotgun Metagenomic SequencingDirected DNA Methylation Sequencing (DM-Seq)mRNA SequencingSingle Cell Gene ExpressionVisium HD Spatial Gene ExpressionXenium In Situ Spatial TranscriptomeOlink ProteomicsUntargeted Metabolomics
Support
NovoMagic Bioinformatics Analysis ToolCustomer Service SystemFalcon Intelligent Delivery Platform
Company
About UsOur LocationsOur PlatformsNewsCareersContact Us
LinkedInLinkedIn hoverYouTubeYouTube hoverXX hover
Copyright © 2026 Novogene Inc. All rights reserved.For Research Use Only. Not for Clinical Diagnostic Use.
Novogene AMEA
  • Novogene AMEA
  • Genomics
    • Human Whole Genome Sequencing
    • Plant and Animal Whole Genome Sequencing
    • Microbial Whole Genome Sequencing
    • Plant and Animal De novo Sequencing
    • Microbial De novo Sequencing
    • Shotgun Metagenomics Sequencing
    • Amplicon Sequencing
    • Whole Exome Sequencing
    Transcriptomics
    • mRNA Sequencing
    • Total RNA Sequencing
    • Full-Length Transcriptome Sequencing
    • Whole Transcriptome Sequencing
    • Small RNA Sequencing
    • Circular RNA Sequencing
    • Metatranscriptome Sequencing
    • Prokaryotic RNA Sequencing
    Single Cell & Spatial Omics
    • Single Cell Gene Expression
    • Single Cell Immune Profiling Sequencing
    • Single Cell Long Read Transcriptome
    • Visium HD Spatial Gene Expression
    • Stereo-Seq Spatial Gene Expression
    • Xenium In Situ Spatial Transcriptome
    Epigenomics
    • Whole Genome Bisulfite Sequencing (WGBS)
    • Directed DNA Methylation Sequencing (DM-Seq) NEW
    • Reduced Representation Bisulfite Sequencing (RRBS)
    • Chromatin Immunoprecipitation Sequencing (ChIP-seq)
    • RNA Immunoprecipitation Sequencing (RIP-seq)
    • Assay for Transposase-Accessible Chromatin with Sequencing (ATAC-seq)

    Premade Library

    • Sequencing Only on Illumina Sequencer
    • Sequencing Only on PacBio Sequencer
    Proteomics and Metabolomics
    • Olink Proteomics
    • Quantitative Proteomics
    • Untargeted Metabolomics
  • PromotionsPromotions
    • Platforms
    • Automated Delivery Platform (Falcon)
    • Bioinformatics Analysis Tool (NovoMagic)
    • Customer Service System (CSS)
    • Brochures
    • Case Studies
    • Webinar
    • Blog
    • Sample Guidelines
    • Cancer Research
    • Immuno-oncology
    • Agrigenomics
    • Environment
    • Food Science
    • Human Microbiome
    • Plant and Animal Microbiome
    • Drug Discovery and Development
    • Rare and Complex Diseases
    • About Us
    • Our Locations
    • News
    • Careers
  • Contact UsContact Us
  1. Home
  2. Resources
  3. Blog
  4. ClusterProfiler – A software for functional enrichment of differentially expressed genes.

ClusterProfiler – A software for functional enrichment of differentially expressed genes.

DNA and RNA sequencing has been a very significant part of molecular biology. RNA sequencing especially anchors itself to the problem of identifying the underlying basis of phenotypic variation. The scope of the phenotypic variation spans from the population level differences in certain biological trait to disease pathology of an individual or a group of individuals. But there are few questions: How to get the huge and complicated sequencing results to make the sequencing data more meaningful, how to select genes related to the biological phenotype, and how to discover the biological pathways that play a key role in the biological process? , to reveal and understand the biology and the basic molecular mechanism of the process. This is where quantification of expressed genes and further refinement of the significant gene candidates takes place.

The analyses of RNA sequence data usually involve identifying genes that respond to a particular stimulus, experimental treatment or show phenotypic differences between two biological groups. The process of quantifying the RNA sequence reads and estimating the variation in transcriptome profiles is called DGEA (Differential Gene Expression Analyses). There are several web and desktop tools (R and python packages) to run DGEA on the aligned RNAseq data. The next step after the DGEA is to further refine the transcriptome profiles by gene families and functions. The main reason for doing this is to identify a group of genes that belong to a certain functional group which will help us justify the phenotype differences between the groups or variation in phenotypic response between the treatment groups. The tools for functional analyses of differentially expressed genes span a variety of methods and are put in 3 major categories: ORA (Over representation analysis), FCS (Functional Class Scoring), and PT (Path Topology).

The overall goal of functional analysis is to provide biological insight into the mechanism of gene to phenotype path. Any identified differentially expressed gene candidates should be analyzed in the context of our experimental hypothesis: e.g say we make a hypothesis that, “FMRP and MOV10 associate and regulate the translation of a subset of RNAs”. This hypothesis would need to be specifically tested to see if a RNAseq candidate shows a significant DGE. Furthermore, the test should be followed on to check if the expression differences are also significant when accounting for the expression of background genes. Therefore, based on the authors’ hypothesis, we may expect the enrichment of processes/pathways related to translation, splicing, and the regulation of mRNAs, which we would need to validate experimentally.

What is “Cluster Profiler”?

“Cluster Profiler” is a R package that provides a statistical tests of over-representation analyses of the GO (gene ontology) terms associated with the list of genes that have shown statistically significant expression differences. The tool takes two inputs: a list of genes that has shown significant expression differences and a list of background gens. A statistical enrichment analysis test is performed using hypergeometric testing. The basic argument of the package allows selecting among GO ontology measures BP (Biological Process), CC (Cellular Component), MF (Molecular Function) to test.

The package supports the following type of analyses:

  • Over-Representation Analysis : This is a statistical method that determines whether genes from pre-defined sets (ex: those belonging to a specific GO term or KEGG pathway) are present more than would be expected (over-represented) in a subset of your data.
  • Gene Set Enrichment Analysis : Gene set enrichment analysis (GSEA) (also functional enrichment analysis) is a method to identify classes of genes or proteins that are over-represented in a large set of genes or proteins and may have an association with disease phenotypes. Here, we describe a powerful analytical method called Gene Set Enrichment Analysis (GSEA) for interpreting gene expression data. The method derives its power by focusing on gene sets, that is, groups of genes that share common biological function, chromosomal location, or regulation.
  • Biological theme comparison : After enrichment and categorizing significantly expressed genes in several gene cluster, researcher may be further interested in identifying and comparing the biological themes among gene clusters.

This package is available on bioconductor https://bioconductor.org/packages/release/bioc/html/clusterProfiler.html

This package implements methods to analyze and visualize functional profiles (GO and KEGG) of gene and gene clusters.

The package takes input data from different sources (microarray, RNAseq). After differential analysis, ordinary enrichment analysis (ORA) can be performed using the packages and tools like enrichGO, KEGG.

Package Usage
1.id conversion

For common model species, you can use the OrgDb annotation package in Bioconductor to achieve id conversion (so far supports annotations for 20 different species, such as humans, mice, fruit flies, zebrafish, etc.).

For unusual non-model species, this can be achieved through AnnotationHub.

2. Enrichment analysis GO/KEGG/GSEA
2.1 The specific steps of GO are as follows: 2.2 The specific operation steps of GO GSEA enrichment are as follows: 2.3 The specific steps of KEGG are as follows: 2.4 The specific steps of GSEA enrichment of KEGG are as follows:

ServicesServices menu

SupportSupport menu

CompanyCompany menu

Services
Whole Genome SequencingDe novo SequencingAmplicon SequencingShotgun Metagenomic SequencingDirected DNA Methylation Sequencing (DM-Seq)mRNA SequencingSingle Cell Gene ExpressionVisium HD Spatial Gene ExpressionXenium In Situ Spatial TranscriptomeOlink ProteomicsUntargeted Metabolomics
Support
NovoMagic Bioinformatics Analysis ToolCustomer Service SystemFalcon Intelligent Delivery Platform
Company
About UsOur LocationsOur PlatformsNewsCareersContact Us
LinkedInLinkedIn hoverYouTubeYouTube hoverXX hover
Copyright © 2026 Novogene Inc. All rights reserved.For Research Use Only. Not for Clinical Diagnostic Use.
Privacy PolicyCookie PolicyCareers