
Novogene AMEA
  • Novogene AMEA
  • Genomics
    • Human Whole Genome Sequencing
    • Plant and Animal Whole Genome Sequencing
    • Microbial Whole Genome Sequencing
    • Plant and Animal De novo Sequencing
    • Microbial De novo Sequencing
    • Shotgun Metagenomics Sequencing
    • Amplicon Sequencing
    • Whole Exome Sequencing
    Transcriptomics
    • mRNA Sequencing
    • Total RNA Sequencing
    • Full-Length Transcriptome Sequencing
    • Whole Transcriptome Sequencing
    • Small RNA Sequencing
    • Circular RNA Sequencing
    • Metatranscriptome Sequencing
    • Prokaryotic RNA Sequencing
    Single Cell & Spatial Omics
    • Single Cell Gene Expression
    • Single Cell Immune Profiling Sequencing
    • Single Cell Long Read Transcriptome
    • Visium HD Spatial Gene Expression
    • Stereo-Seq Spatial Gene Expression
    • Xenium In Situ Spatial Transcriptome
    Epigenomics
    • Whole Genome Bisulfite Sequencing (WGBS)
    • Directed DNA Methylation Sequencing (DM-Seq) NEW
    • Reduced Representation Bisulfite Sequencing (RRBS)
    • Chromatin Immunoprecipitation Sequencing (ChIP-seq)
    • RNA Immunoprecipitation Sequencing (RIP-seq)
    • Assay for Transposase-Accessible Chromatin with Sequencing (ATAC-seq)

    Premade Library

    • Sequencing Only on Illumina Sequencer
    • Sequencing Only on PacBio Sequencer
    Proteomics and Metabolomics
    • Olink Proteomics
    • Quantitative Proteomics
    • Untargeted Metabolomics
  • PromotionsPromotions
    • Platforms
    • Automated Delivery Platform (Falcon)
    • Bioinformatics Analysis Tool (NovoMagic)
    • Customer Service System (CSS)
    • Brochures
    • Case Studies
    • Webinar
    • Blog
    • Sample Guidelines
    • Cancer Research
    • Immuno-oncology
    • Agrigenomics
    • Environment
    • Food Science
    • Human Microbiome
    • Plant and Animal Microbiome
    • Drug Discovery and Development
    • Rare and Complex Diseases
    • About Us
    • Our Locations
    • News
    • Careers
  • Contact UsContact Us
  1. Home
  2. Resources
  3. Blog
  4. Four Powered Online Tools for Genomic Analysis and Visualization (IV) – circos

Four Powered Online Tools for Genomic Analysis and Visualization (IV) – circos

IV.circos – circos diagram

Circos is a command-line software that can be used for visualizing data and information. The online application is suitable for creating rigorously informative infographics with texture and aesthetic appeal. It can create both low-resolution bitmaps for web-page integration, as well as high-resolution publication standard images.
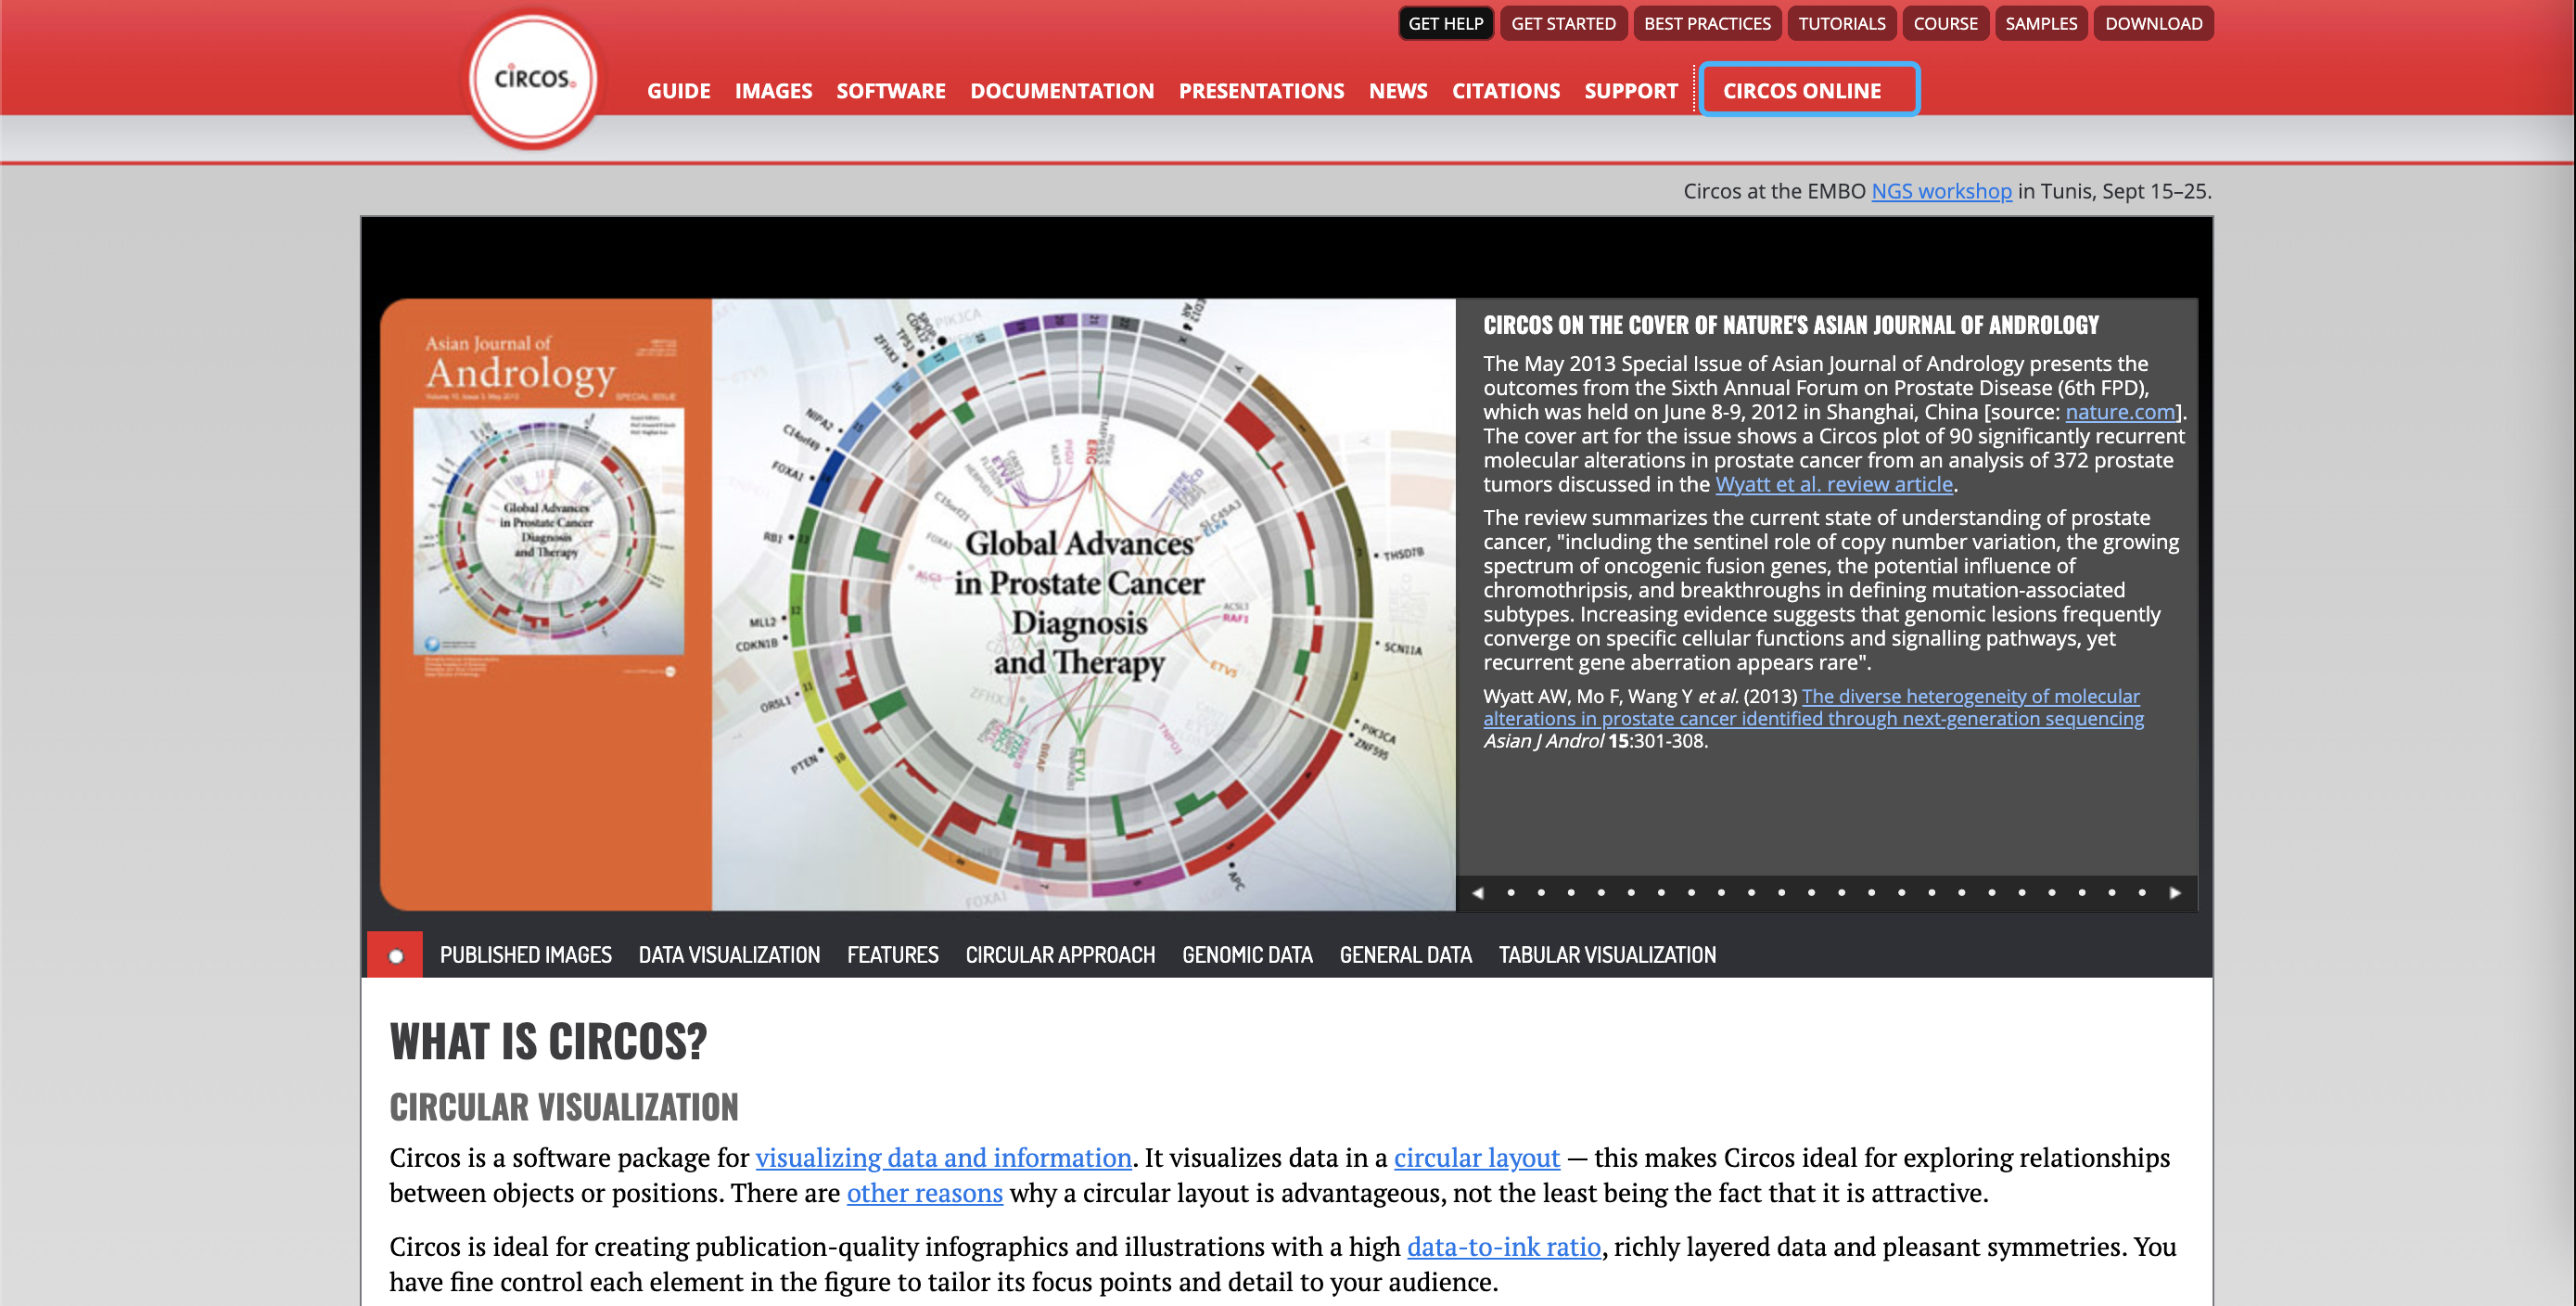
Circos specifically visualize data in a circular layout which makes it the perfect tool for exploring and representing relationships between objects and positions. With its high data-to-ink ratio, circos creates images that are highly attractive. Each element in the image is modular and controllable, and allows the user to tailor the focus points and details catered to the audience’s appeal. Get the figure from http://mkweb.bcgsc.ca/tableviewer/visualize/.
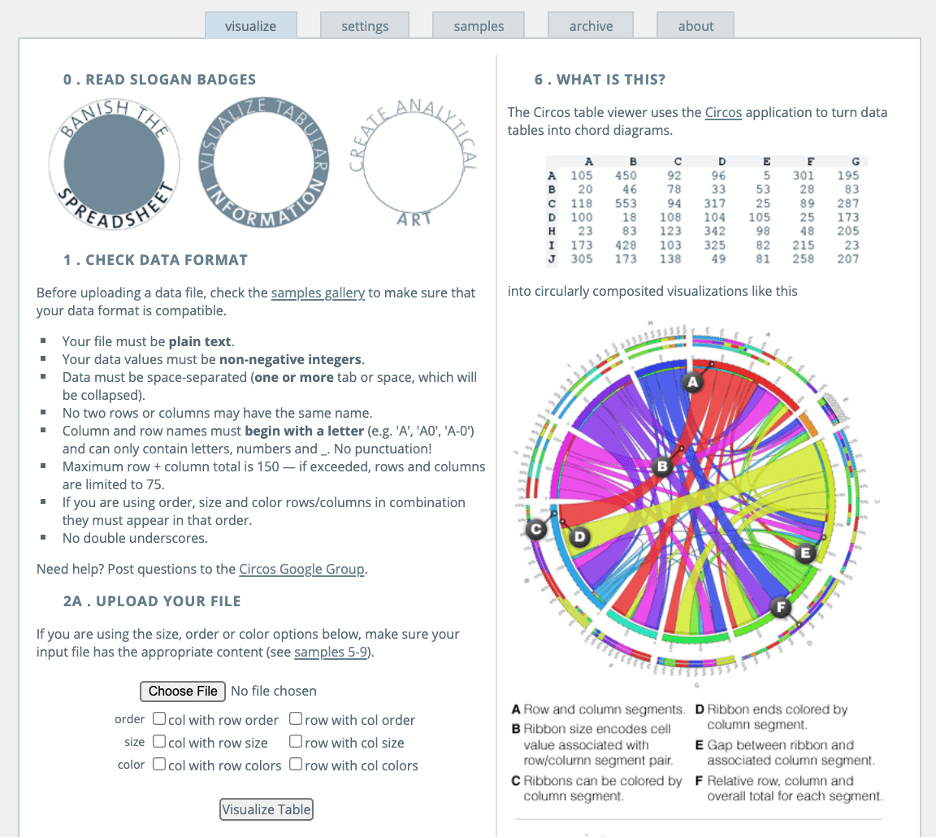
For input, circos takes GFF-style data files and Apache-like configuration files both of which can be easily generated by automated tools. The configuration is modular, and parameter blocks are reusable when imported from multiple files. The output images hence generated can be created in PNG (8 or 24 bit) or SVG formats. Intuitive and easy to play around, circos definitely is a tool that makes a biological scientist’s work more palatable and attractive for a wider audience[1].

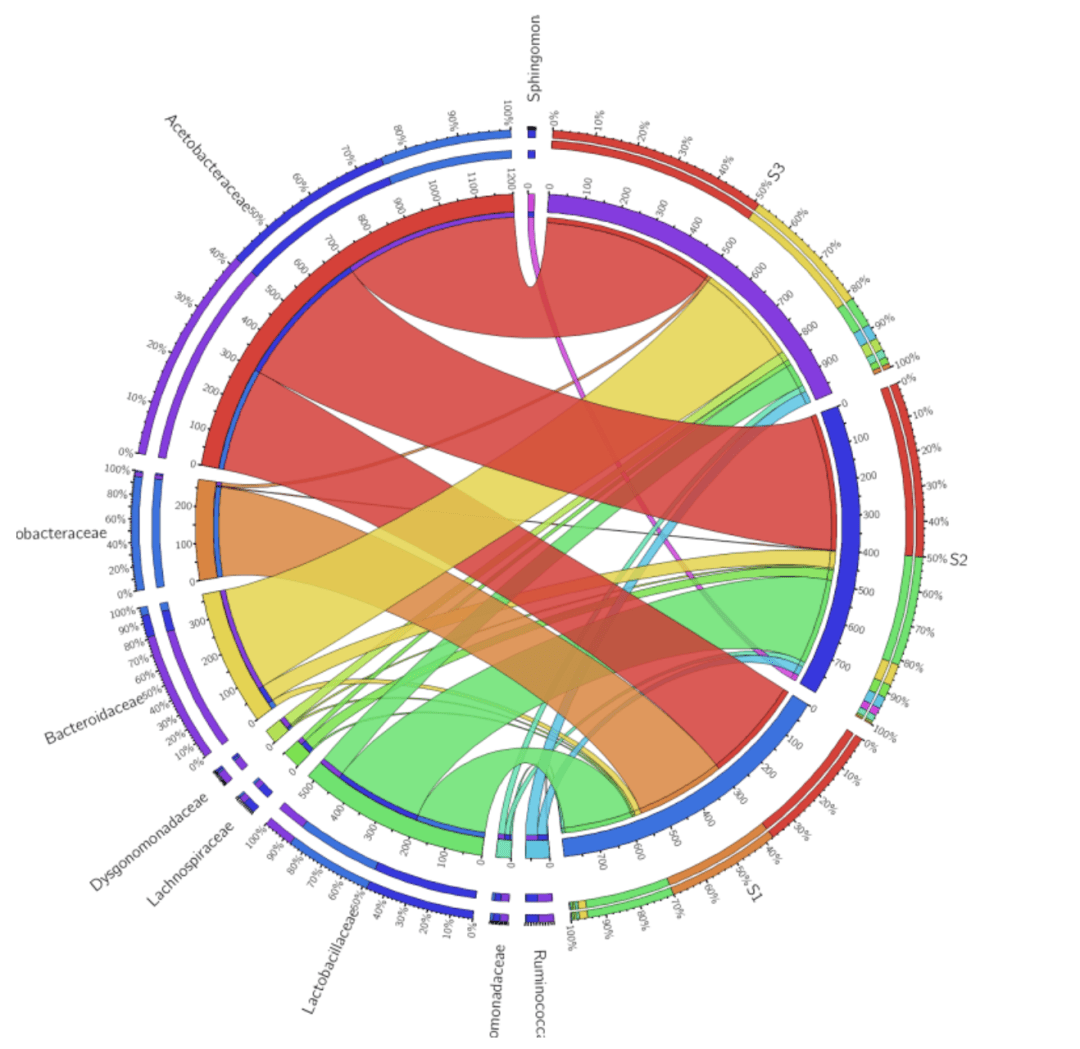
Taking the analysis of the microbial abundance and species diversity as an example, here shows demos to explain the function of drawing the circos diagram.

1) Data Preparation

The data used are the relative abundance of species in each sample, as follows (S1, S2, S3 are sample names in columns, and Acetobacteraceae, and other species classifications are in rows). Please note that the data formats are required in a non-negative integer.

OTUS1S2S3
Acetobacteraceae300400450
Sphingomonadaceae0180
Bacteroidaceae1950300
Ruminococcaceae32735
Pseudomonadaceae71519
Lactobacillaceae20025070
Lachnospiraceae53015
Dysgonomonadaceae5529
Arcobacteraceae260310

2) Diagram Generation & Saving

Upload your data file and click button of “Visualize Table”. Then you will get the Circos image ready. By setting the segments, labels and other parameters, the layout of the images will be optimized based on your own needs.
Reference [1] Krzywinski, Martin et al. “Circos: an information aesthetic for comparative genomics.” Genome research vol. 19,9 (2009): 1639-45. doi:10.1101/gr.092759.109

ServicesServices menu

SupportSupport menu

CompanyCompany menu

Services
Whole Genome SequencingDe novo SequencingAmplicon SequencingShotgun Metagenomic SequencingDirected DNA Methylation Sequencing (DM-Seq)mRNA SequencingSingle Cell Gene ExpressionVisium HD Spatial Gene ExpressionXenium In Situ Spatial TranscriptomeOlink ProteomicsUntargeted Metabolomics
Support
NovoMagic Bioinformatics Analysis ToolCustomer Service SystemFalcon Intelligent Delivery Platform
Company
About UsOur LocationsOur PlatformsNewsCareersContact Us
LinkedInLinkedIn hoverYouTubeYouTube hoverXX hover
Copyright © 2026 Novogene Inc. All rights reserved.For Research Use Only. Not for Clinical Diagnostic Use.
Novogene AMEA
  • Novogene AMEA
  • Genomics
    • Human Whole Genome Sequencing
    • Plant and Animal Whole Genome Sequencing
    • Microbial Whole Genome Sequencing
    • Plant and Animal De novo Sequencing
    • Microbial De novo Sequencing
    • Shotgun Metagenomics Sequencing
    • Amplicon Sequencing
    • Whole Exome Sequencing
    Transcriptomics
    • mRNA Sequencing
    • Total RNA Sequencing
    • Full-Length Transcriptome Sequencing
    • Whole Transcriptome Sequencing
    • Small RNA Sequencing
    • Circular RNA Sequencing
    • Metatranscriptome Sequencing
    • Prokaryotic RNA Sequencing
    Single Cell & Spatial Omics
    • Single Cell Gene Expression
    • Single Cell Immune Profiling Sequencing
    • Single Cell Long Read Transcriptome
    • Visium HD Spatial Gene Expression
    • Stereo-Seq Spatial Gene Expression
    • Xenium In Situ Spatial Transcriptome
    Epigenomics
    • Whole Genome Bisulfite Sequencing (WGBS)
    • Directed DNA Methylation Sequencing (DM-Seq) NEW
    • Reduced Representation Bisulfite Sequencing (RRBS)
    • Chromatin Immunoprecipitation Sequencing (ChIP-seq)
    • RNA Immunoprecipitation Sequencing (RIP-seq)
    • Assay for Transposase-Accessible Chromatin with Sequencing (ATAC-seq)

    Premade Library

    • Sequencing Only on Illumina Sequencer
    • Sequencing Only on PacBio Sequencer
    Proteomics and Metabolomics
    • Olink Proteomics
    • Quantitative Proteomics
    • Untargeted Metabolomics
  • PromotionsPromotions
    • Platforms
    • Automated Delivery Platform (Falcon)
    • Bioinformatics Analysis Tool (NovoMagic)
    • Customer Service System (CSS)
    • Brochures
    • Case Studies
    • Webinar
    • Blog
    • Sample Guidelines
    • Cancer Research
    • Immuno-oncology
    • Agrigenomics
    • Environment
    • Food Science
    • Human Microbiome
    • Plant and Animal Microbiome
    • Drug Discovery and Development
    • Rare and Complex Diseases
    • About Us
    • Our Locations
    • News
    • Careers
  • Contact UsContact Us
  1. Home
  2. Resources
  3. Blog
  4. Four Powered Online Tools for Genomic Analysis and Visualization (IV) – circos

Four Powered Online Tools for Genomic Analysis and Visualization (IV) – circos

IV.circos – circos diagram

Circos is a command-line software that can be used for visualizing data and information. The online application is suitable for creating rigorously informative infographics with texture and aesthetic appeal. It can create both low-resolution bitmaps for web-page integration, as well as high-resolution publication standard images.

Circos specifically visualize data in a circular layout which makes it the perfect tool for exploring and representing relationships between objects and positions. With its high data-to-ink ratio, circos creates images that are highly attractive. Each element in the image is modular and controllable, and allows the user to tailor the focus points and details catered to the audience’s appeal. Get the figure from http://mkweb.bcgsc.ca/tableviewer/visualize/.

For input, circos takes GFF-style data files and Apache-like configuration files both of which can be easily generated by automated tools. The configuration is modular, and parameter blocks are reusable when imported from multiple files. The output images hence generated can be created in PNG (8 or 24 bit) or SVG formats. Intuitive and easy to play around, circos definitely is a tool that makes a biological scientist’s work more palatable and attractive for a wider audience[1].

Taking the analysis of the microbial abundance and species diversity as an example, here shows demos to explain the function of drawing the circos diagram.

1) Data Preparation

The data used are the relative abundance of species in each sample, as follows (S1, S2, S3 are sample names in columns, and Acetobacteraceae, and other species classifications are in rows). Please note that the data formats are required in a non-negative integer.

OTUS1S2S3
Acetobacteraceae300400450
Sphingomonadaceae0180
Bacteroidaceae1950300
Ruminococcaceae32735
Pseudomonadaceae71519
Lactobacillaceae20025070
Lachnospiraceae53015
Dysgonomonadaceae5529
Arcobacteraceae260310

2) Diagram Generation & Saving

Upload your data file and click button of “Visualize Table”. Then you will get the Circos image ready. By setting the segments, labels and other parameters, the layout of the images will be optimized based on your own needs.

Reference [1] Krzywinski, Martin et al. “Circos: an information aesthetic for comparative genomics.” Genome research vol. 19,9 (2009): 1639-45. doi:10.1101/gr.092759.109

ServicesServices menu

SupportSupport menu

CompanyCompany menu

Services
Whole Genome SequencingDe novo SequencingAmplicon SequencingShotgun Metagenomic SequencingDirected DNA Methylation Sequencing (DM-Seq)mRNA SequencingSingle Cell Gene ExpressionVisium HD Spatial Gene ExpressionXenium In Situ Spatial TranscriptomeOlink ProteomicsUntargeted Metabolomics
Support
NovoMagic Bioinformatics Analysis ToolCustomer Service SystemFalcon Intelligent Delivery Platform
Company
About UsOur LocationsOur PlatformsNewsCareersContact Us
LinkedInLinkedIn hoverYouTubeYouTube hoverXX hover
Copyright © 2026 Novogene Inc. All rights reserved.For Research Use Only. Not for Clinical Diagnostic Use.
Privacy PolicyCookie PolicyCareers