
Novogene AMEA
  • Novogene AMEA
  • Genomics
    • Human Whole Genome Sequencing
    • Plant and Animal Whole Genome Sequencing
    • Microbial Whole Genome Sequencing
    • Plant and Animal De novo Sequencing
    • Microbial De novo Sequencing
    • Shotgun Metagenomics Sequencing
    • Amplicon Sequencing
    • Whole Exome Sequencing
    Transcriptomics
    • mRNA Sequencing
    • Total RNA Sequencing
    • Full-Length Transcriptome Sequencing
    • Whole Transcriptome Sequencing
    • Small RNA Sequencing
    • Circular RNA Sequencing
    • Metatranscriptome Sequencing
    • Prokaryotic RNA Sequencing
    Single Cell & Spatial Omics
    • Single Cell Gene Expression
    • Single Cell Immune Profiling Sequencing
    • Single Cell Long Read Transcriptome
    • Visium HD Spatial Gene Expression
    • Stereo-Seq Spatial Gene Expression
    • Xenium In Situ Spatial Transcriptome
    Epigenomics
    • Whole Genome Bisulfite Sequencing (WGBS)
    • Directed DNA Methylation Sequencing (DM-Seq) NEW
    • Reduced Representation Bisulfite Sequencing (RRBS)
    • Chromatin Immunoprecipitation Sequencing (ChIP-seq)
    • RNA Immunoprecipitation Sequencing (RIP-seq)
    • Assay for Transposase-Accessible Chromatin with Sequencing (ATAC-seq)

    Premade Library

    • Sequencing Only on Illumina Sequencer
    • Sequencing Only on PacBio Sequencer
    Proteomics and Metabolomics
    • Olink Proteomics
    • Quantitative Proteomics
    • Untargeted Metabolomics
  • PromotionsPromotions
    • Platforms
    • Automated Delivery Platform (Falcon)
    • Bioinformatics Analysis Tool (NovoMagic)
    • Customer Service System (CSS)
    • Brochures
    • Case Studies
    • Webinar
    • Blog
    • Sample Guidelines
    • Cancer Research
    • Immuno-oncology
    • Agrigenomics
    • Environment
    • Food Science
    • Human Microbiome
    • Plant and Animal Microbiome
    • Drug Discovery and Development
    • Rare and Complex Diseases
    • About Us
    • Our Locations
    • News
    • Careers
  • Contact UsContact Us
  1. Home
  2. Resources
  3. Blog
  4. Olink vs Mass Spectrometry: Unique Advantages and the Power of Synergy

Olink vs Mass Spectrometry: Unique Advantages and the Power of Synergy

581 September, 2025

Proteins, as essential biomarkers of physiological processes, serve as critical tools for disease diagnosis and research. Among various biological samples, blood is the most commonly utilized in clinical research due to its rich molecular composition. Plasma proteins, which number around 12,000 distinct types, exhibit significant variability in their concentrations. The top 10 most abundant proteins account for over 90% of the total protein content, while the remaining low-abundance proteins—often containing valuable disease-related information—comprise less than 10%. These low-abundance proteins are frequently masked by high-abundance proteins during detection, which represents a major challenge in plasma proteomics research.
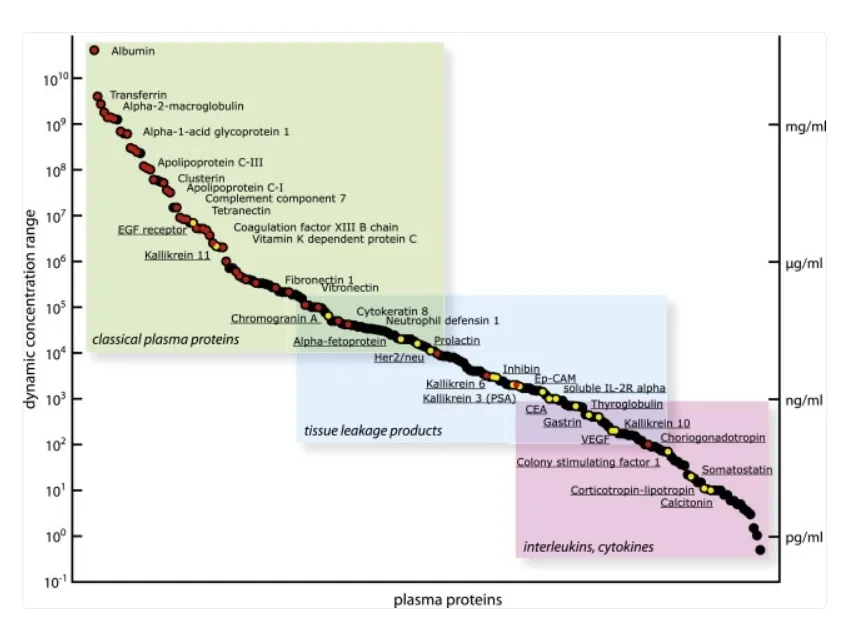
Concentration distribution of plasma proteins [1]; Red dots: Proteins identified by the Human Proteome Organization (HUPO); Yellow dots: Biomarkers.

Mass Spectrometry: Mass spectrometry (MS), as a representative of untargeted proteomics technologies, remains one of the most widely adopted techniques in proteomics research. The technique is primarily based on liquid chromatography-mass spectrometry (LC-MS), wherein peptides are ionized and detected according to their mass-to-charge ratio (m/z). By leveraging database searches and bioinformatics tools, mass spectrometry enables not only protein quantification but also the exploration of protein sequences, post-translational modifications, and other areas of proteomic analysis. It is versatile, applicable across a broad range of species and sample types. To enhance the accuracy and reliability of low-abundance plasma protein detection, mass spectrometry can be coupled with methods for high-abundance protein depletion, facilitating deep and comprehensive identification of plasma proteins.
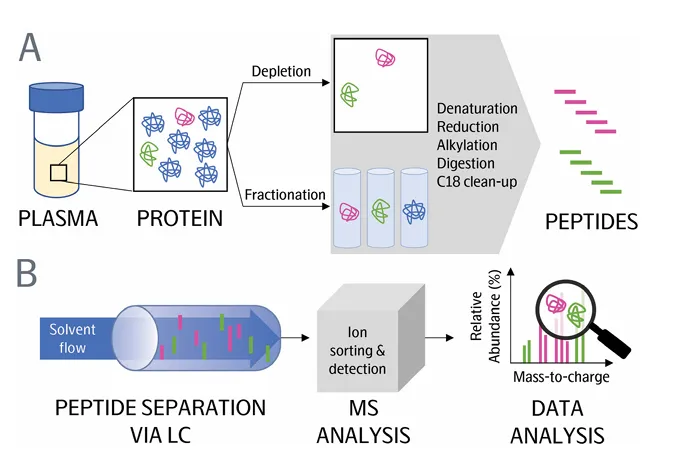
Introduction to the Principles of Mass Spectrometry [2]

Olink: As a representative of targeted proteomics technology, Olink utilizes the Proximity Extension Assay (PEA) platform. This method employs two antibodies, each conjugated with a unique single-stranded DNA, to specifically bind to the target protein. Upon binding to the same protein, the DNA strands from each antibody can pair to form a double-stranded DNA template, thereby converting protein quantification into DNA quantification. Subsequent quantitative analysis is performed using next-generation sequencing (NGS) or quantitative PCR (qPCR) technologies. The core technology of Olink is based on antibody affinity reactions, and its high specificity allows for reduced sample input. A single experiment can simultaneously achieve highly sensitive detection of both high-abundance and low-abundance proteins. Olink offers a variety of panels, such as Explore HT, Reveal, Explore 384/1536/3072, and Target 96/48, which are particularly suitable for biomarker discovery, screening, validation, and clinical translation in medical and diagnostic research.
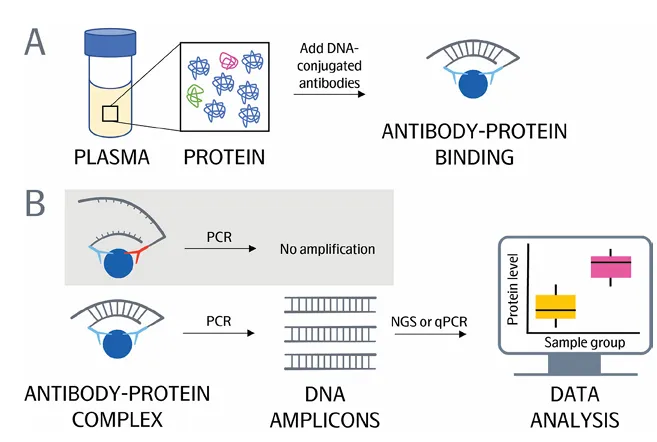
Introduction to the Principles of Olink Proteomics [2]

To learn more about the comparison between Mass Spectrometry and Olink Proteomics methods, check out this white paper: [link].

To enhance the comprehensiveness and accuracy of plasma protein biomarker research, researchers can combine Olink and mass spectrometry technologies to capitalize on the unique strengths of each method. Below is a comparison of Olink with several mass spectrometry platforms:
In this article published in the Journal of Proteome Research by William F. Beimers et al., the detection performance of Olink proteomics is compared with five different mass spectrometry proteomics platforms for plasma samples. [3]:

Sequencing platform:
  • LC-MS Platform: Vanquish Neo nanoLC coupled with Orbitrap Astral MS, data collected using Data-Independent Acquisition (DIA) mode.
  • LC-MS Sample Preprocessing Methods: Neat (without low-abundance protein enrichment), Acid (acid depletion), PreOmics ENRICHplus, Mag-Net, Seer Proteograph XT.
  • Olink Platform: Olink Explore HT panel, targeting over 5400 proteins.
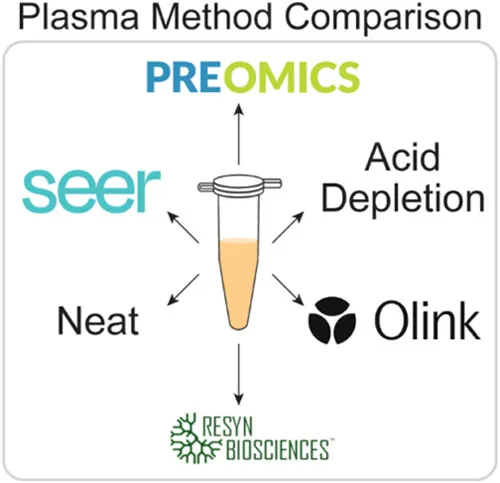
Plasma Method Comparsion [3]

Sample Source:

Commercially available standard frozen plasma; clinical plasma samples (20 non-small cell lung cancer patients + 20 age- and sex-matched healthy controls).

Result:

The table below summarizes the performance of Olink compared to five mass spectrometry methods.

Starting Quantity: Neat < Olink < Acid < PreOmics < Mag-Net < Seer;

Throughput: Olink > Others;

Price: Neat/Acid/Mag-Net < PreOmics < Olink/Seer;

Sample Preprocessing Complexity: Olink < Others;

Number of Proteins Detected: Seer > Olink > PreOmics > Mag-Net > Acid > Neat.
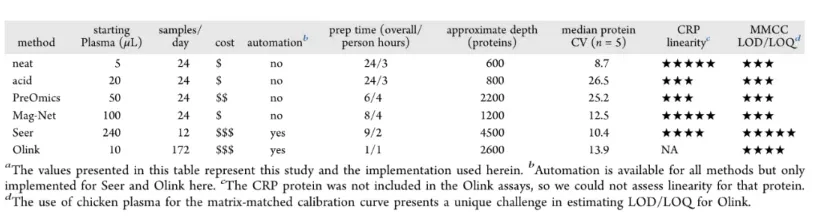
Overview of Various Plasma Proteomics Technologies [3]

How to Select a Proteomics Technology Solution for Different Research Scenarios? Different panels to support proteomics from [discovery & screening] to [verification & validation] (Adapted from J Proteome Res. 2025 Jan 13;24(2):459–471.[4])
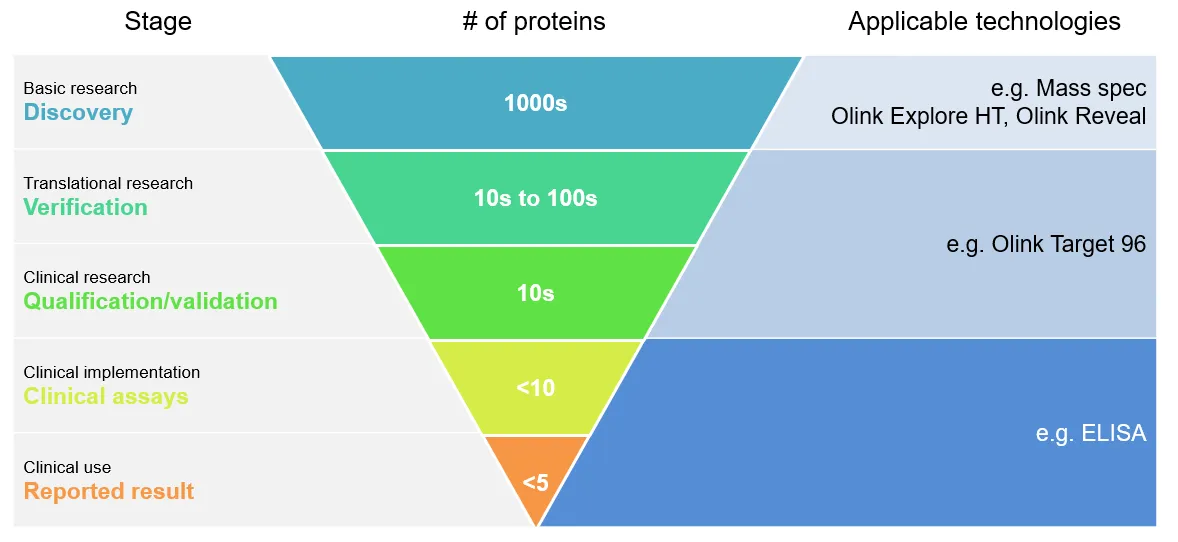
Early Stage of Biomarker Discovery: This stage focuses on large-scale screening of potential targets. Non-targeted mass spectrometry technologies can be employed to identify additional unknown proteins. Alternatively, Olink Explore HT, Reveal, or Explore 1536/3072 can be utilized for targeted, efficient, and rapid screening.

Biomarker Validation Stage: At this stage, more specific and quantitative measurement of protein biomarkers is required. Olink Explore 384 and Target 96/48 panels, tailored for various disease contexts, offer distinct advantages, including enhanced reproducibility, sensitivity, and a broader dynamic range, facilitating biomarker validation.

Clinical Application and Dissemination Stage of Biomarkers: ELISA, as the clinical gold standard, remains the most widely accepted and utilized detection method in clinical practice.

Reference:

[1] Ralph Schiess, Bernd Wollscheid, Ruedi Aebersold. Targeted proteomic strategy for clinical biomarker discovery. Mol Oncol. 2008, 3(1):33-44.

[2] How Olink® technology complements mass spectrometry. Olink White paper

[3] William F Beimers, Katherine A Overmyer, Pavel Sinitcyn, et al. Technical Evaluation of Plasma Proteomics Technologies. J Proteome Res. 2025, 24(6):3074-3087

[4] Constance A Sobsey, Gerald Batist, Christoph H Borchers. Characterization of 53 Multiplexed Targeted Proteomics Assays for Verification Studies in Cancer Cell Lines. J Proteome Res. 2025, 24(2):459-471.

ServicesServices menu

SupportSupport menu

CompanyCompany menu

Services
Whole Genome SequencingDe novo SequencingAmplicon SequencingShotgun Metagenomic SequencingDirected DNA Methylation Sequencing (DM-Seq)mRNA SequencingSingle Cell Gene ExpressionVisium HD Spatial Gene ExpressionXenium In Situ Spatial TranscriptomeOlink ProteomicsUntargeted Metabolomics
Support
NovoMagic Bioinformatics Analysis ToolCustomer Service SystemFalcon Intelligent Delivery Platform
Company
About UsOur LocationsOur PlatformsNewsCareersContact Us
LinkedInLinkedIn hoverYouTubeYouTube hoverXX hover
Copyright © 2026 Novogene Inc. All rights reserved.For Research Use Only. Not for Clinical Diagnostic Use.
Novogene AMEA
  • Novogene AMEA
  • Genomics
    • Human Whole Genome Sequencing
    • Plant and Animal Whole Genome Sequencing
    • Microbial Whole Genome Sequencing
    • Plant and Animal De novo Sequencing
    • Microbial De novo Sequencing
    • Shotgun Metagenomics Sequencing
    • Amplicon Sequencing
    • Whole Exome Sequencing
    Transcriptomics
    • mRNA Sequencing
    • Total RNA Sequencing
    • Full-Length Transcriptome Sequencing
    • Whole Transcriptome Sequencing
    • Small RNA Sequencing
    • Circular RNA Sequencing
    • Metatranscriptome Sequencing
    • Prokaryotic RNA Sequencing
    Single Cell & Spatial Omics
    • Single Cell Gene Expression
    • Single Cell Immune Profiling Sequencing
    • Single Cell Long Read Transcriptome
    • Visium HD Spatial Gene Expression
    • Stereo-Seq Spatial Gene Expression
    • Xenium In Situ Spatial Transcriptome
    Epigenomics
    • Whole Genome Bisulfite Sequencing (WGBS)
    • Directed DNA Methylation Sequencing (DM-Seq) NEW
    • Reduced Representation Bisulfite Sequencing (RRBS)
    • Chromatin Immunoprecipitation Sequencing (ChIP-seq)
    • RNA Immunoprecipitation Sequencing (RIP-seq)
    • Assay for Transposase-Accessible Chromatin with Sequencing (ATAC-seq)

    Premade Library

    • Sequencing Only on Illumina Sequencer
    • Sequencing Only on PacBio Sequencer
    Proteomics and Metabolomics
    • Olink Proteomics
    • Quantitative Proteomics
    • Untargeted Metabolomics
  • PromotionsPromotions
    • Platforms
    • Automated Delivery Platform (Falcon)
    • Bioinformatics Analysis Tool (NovoMagic)
    • Customer Service System (CSS)
    • Brochures
    • Case Studies
    • Webinar
    • Blog
    • Sample Guidelines
    • Cancer Research
    • Immuno-oncology
    • Agrigenomics
    • Environment
    • Food Science
    • Human Microbiome
    • Plant and Animal Microbiome
    • Drug Discovery and Development
    • Rare and Complex Diseases
    • About Us
    • Our Locations
    • News
    • Careers
  • Contact UsContact Us
  1. Home
  2. Resources
  3. Blog
  4. Olink vs Mass Spectrometry: Unique Advantages and the Power of Synergy

Olink vs Mass Spectrometry: Unique Advantages and the Power of Synergy

581 September, 2025

Proteins, as essential biomarkers of physiological processes, serve as critical tools for disease diagnosis and research. Among various biological samples, blood is the most commonly utilized in clinical research due to its rich molecular composition. Plasma proteins, which number around 12,000 distinct types, exhibit significant variability in their concentrations. The top 10 most abundant proteins account for over 90% of the total protein content, while the remaining low-abundance proteins—often containing valuable disease-related information—comprise less than 10%. These low-abundance proteins are frequently masked by high-abundance proteins during detection, which represents a major challenge in plasma proteomics research.

Concentration distribution of plasma proteins [1]; Red dots: Proteins identified by the Human Proteome Organization (HUPO); Yellow dots: Biomarkers.

Mass Spectrometry: Mass spectrometry (MS), as a representative of untargeted proteomics technologies, remains one of the most widely adopted techniques in proteomics research. The technique is primarily based on liquid chromatography-mass spectrometry (LC-MS), wherein peptides are ionized and detected according to their mass-to-charge ratio (m/z). By leveraging database searches and bioinformatics tools, mass spectrometry enables not only protein quantification but also the exploration of protein sequences, post-translational modifications, and other areas of proteomic analysis. It is versatile, applicable across a broad range of species and sample types. To enhance the accuracy and reliability of low-abundance plasma protein detection, mass spectrometry can be coupled with methods for high-abundance protein depletion, facilitating deep and comprehensive identification of plasma proteins.

Introduction to the Principles of Mass Spectrometry [2]

Olink: As a representative of targeted proteomics technology, Olink utilizes the Proximity Extension Assay (PEA) platform. This method employs two antibodies, each conjugated with a unique single-stranded DNA, to specifically bind to the target protein. Upon binding to the same protein, the DNA strands from each antibody can pair to form a double-stranded DNA template, thereby converting protein quantification into DNA quantification. Subsequent quantitative analysis is performed using next-generation sequencing (NGS) or quantitative PCR (qPCR) technologies. The core technology of Olink is based on antibody affinity reactions, and its high specificity allows for reduced sample input. A single experiment can simultaneously achieve highly sensitive detection of both high-abundance and low-abundance proteins. Olink offers a variety of panels, such as Explore HT, Reveal, Explore 384/1536/3072, and Target 96/48, which are particularly suitable for biomarker discovery, screening, validation, and clinical translation in medical and diagnostic research.

Introduction to the Principles of Olink Proteomics [2]

To learn more about the comparison between Mass Spectrometry and Olink Proteomics methods, check out this white paper: [link].

To enhance the comprehensiveness and accuracy of plasma protein biomarker research, researchers can combine Olink and mass spectrometry technologies to capitalize on the unique strengths of each method. Below is a comparison of Olink with several mass spectrometry platforms:

In this article published in the Journal of Proteome Research by William F. Beimers et al., the detection performance of Olink proteomics is compared with five different mass spectrometry proteomics platforms for plasma samples. [3]:

Sequencing platform:
  • LC-MS Platform: Vanquish Neo nanoLC coupled with Orbitrap Astral MS, data collected using Data-Independent Acquisition (DIA) mode.
  • LC-MS Sample Preprocessing Methods: Neat (without low-abundance protein enrichment), Acid (acid depletion), PreOmics ENRICHplus, Mag-Net, Seer Proteograph XT.
  • Olink Platform: Olink Explore HT panel, targeting over 5400 proteins.

Plasma Method Comparsion [3]

Sample Source:

Commercially available standard frozen plasma; clinical plasma samples (20 non-small cell lung cancer patients + 20 age- and sex-matched healthy controls).

Result:

The table below summarizes the performance of Olink compared to five mass spectrometry methods.

Starting Quantity: Neat < Olink < Acid < PreOmics < Mag-Net < Seer;

Throughput: Olink > Others;

Price: Neat/Acid/Mag-Net < PreOmics < Olink/Seer;

Sample Preprocessing Complexity: Olink < Others;

Number of Proteins Detected: Seer > Olink > PreOmics > Mag-Net > Acid > Neat.

Overview of Various Plasma Proteomics Technologies [3]

How to Select a Proteomics Technology Solution for Different Research Scenarios? Different panels to support proteomics from [discovery & screening] to [verification & validation] (Adapted from J Proteome Res. 2025 Jan 13;24(2):459–471.[4])

Early Stage of Biomarker Discovery: This stage focuses on large-scale screening of potential targets. Non-targeted mass spectrometry technologies can be employed to identify additional unknown proteins. Alternatively, Olink Explore HT, Reveal, or Explore 1536/3072 can be utilized for targeted, efficient, and rapid screening.

Biomarker Validation Stage: At this stage, more specific and quantitative measurement of protein biomarkers is required. Olink Explore 384 and Target 96/48 panels, tailored for various disease contexts, offer distinct advantages, including enhanced reproducibility, sensitivity, and a broader dynamic range, facilitating biomarker validation.

Clinical Application and Dissemination Stage of Biomarkers: ELISA, as the clinical gold standard, remains the most widely accepted and utilized detection method in clinical practice.

Reference:

[1] Ralph Schiess, Bernd Wollscheid, Ruedi Aebersold. Targeted proteomic strategy for clinical biomarker discovery. Mol Oncol. 2008, 3(1):33-44.

[2] How Olink® technology complements mass spectrometry. Olink White paper

[3] William F Beimers, Katherine A Overmyer, Pavel Sinitcyn, et al. Technical Evaluation of Plasma Proteomics Technologies. J Proteome Res. 2025, 24(6):3074-3087

[4] Constance A Sobsey, Gerald Batist, Christoph H Borchers. Characterization of 53 Multiplexed Targeted Proteomics Assays for Verification Studies in Cancer Cell Lines. J Proteome Res. 2025, 24(2):459-471.

ServicesServices menu

SupportSupport menu

CompanyCompany menu

Services
Whole Genome SequencingDe novo SequencingAmplicon SequencingShotgun Metagenomic SequencingDirected DNA Methylation Sequencing (DM-Seq)mRNA SequencingSingle Cell Gene ExpressionVisium HD Spatial Gene ExpressionXenium In Situ Spatial TranscriptomeOlink ProteomicsUntargeted Metabolomics
Support
NovoMagic Bioinformatics Analysis ToolCustomer Service SystemFalcon Intelligent Delivery Platform
Company
About UsOur LocationsOur PlatformsNewsCareersContact Us
LinkedInLinkedIn hoverYouTubeYouTube hoverXX hover
Copyright © 2026 Novogene Inc. All rights reserved.For Research Use Only. Not for Clinical Diagnostic Use.
Privacy PolicyCookie PolicyCareers